Fig. 1.
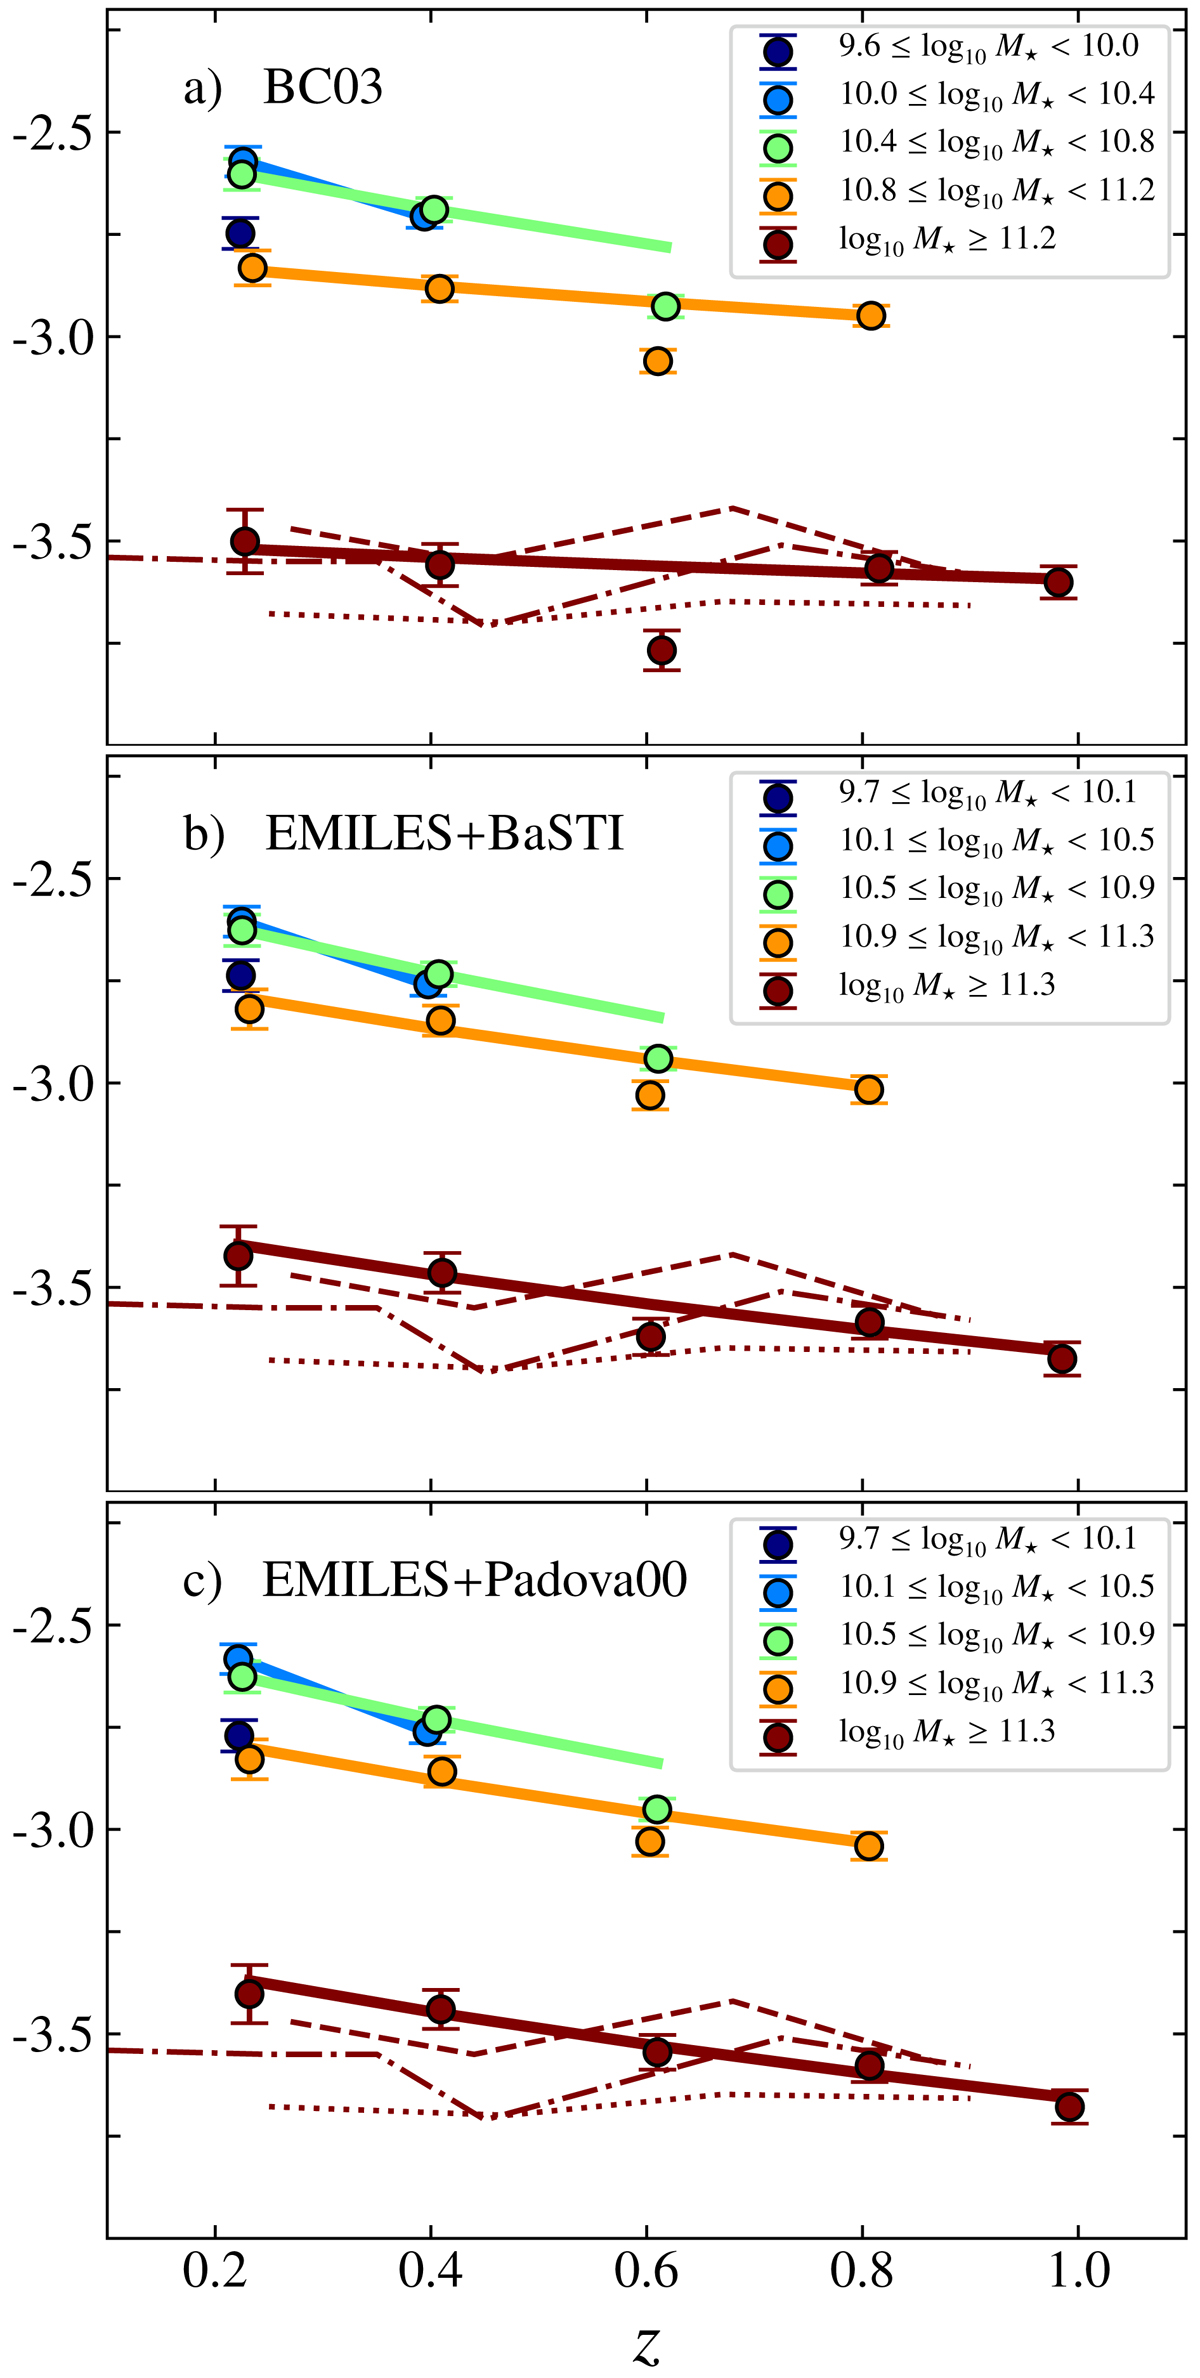
Evolution of number density (Y-axis) of quiescent galaxies in ALHAMBRA with redshift (X-axis), for different stellar mass bins (see inner-panels). Coloured dots illustrate number densities when using a 1/Vmax formalism, whereas solid lines show the best fit to Eq. (1). From top to bottom, number densities obtained from BC03, EMILES+BaSTI, and EMILES+Padova00 SSP models (panels a, b, and c, respectively). Over-plotted, we show the evolution on the number density of massive quiescent galaxies, log10 M⋆ ≥ 11, with redshift from the previous work of Pozzetti et al. (2010, dashed line), Moresco et al. (2013, dotted line), and Moustakas et al. (2013, dash-dot line). In all cases, the number densities at the 0.5 < z < 0.7 bin are excluded from the fit as explained in the text.
Current usage metrics show cumulative count of Article Views (full-text article views including HTML views, PDF and ePub downloads, according to the available data) and Abstracts Views on Vision4Press platform.
Data correspond to usage on the plateform after 2015. The current usage metrics is available 48-96 hours after online publication and is updated daily on week days.
Initial download of the metrics may take a while.