Fig. 5.
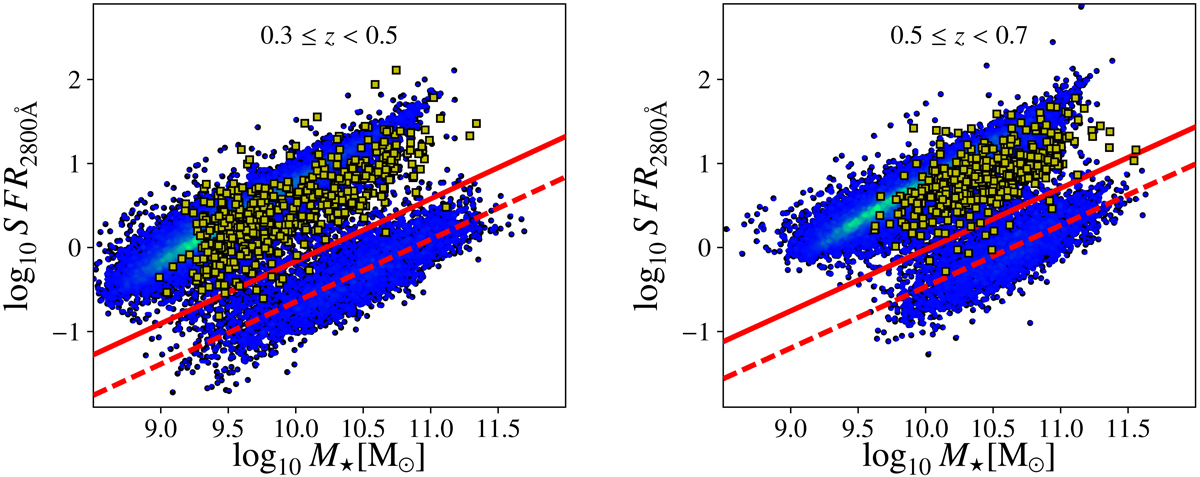
Stellar mass (X-axis) vs. star formation rate tracer SFR2800 Å (Y-axis) defined by Madau et al. (1998, see Eq. (8)) of ALHAMBRA galaxies at redshift 0.3 ≤ z < 0.5 (left panel) and 0.5 ≤ z < 0.7 (right panel). High densities are presented in green, and lower densities in blue. The dashed and solid red lines show the fit to the quiescent sequence and the limiting SFR2800 Å values for star-forming galaxies, respectively. The yellow markers illustrate galaxies labelled as dusty star-forming galaxies by the rest-frame stellar mass–colour diagram corrected for extinction (MCDE).
Current usage metrics show cumulative count of Article Views (full-text article views including HTML views, PDF and ePub downloads, according to the available data) and Abstracts Views on Vision4Press platform.
Data correspond to usage on the plateform after 2015. The current usage metrics is available 48-96 hours after online publication and is updated daily on week days.
Initial download of the metrics may take a while.