Fig. 4.
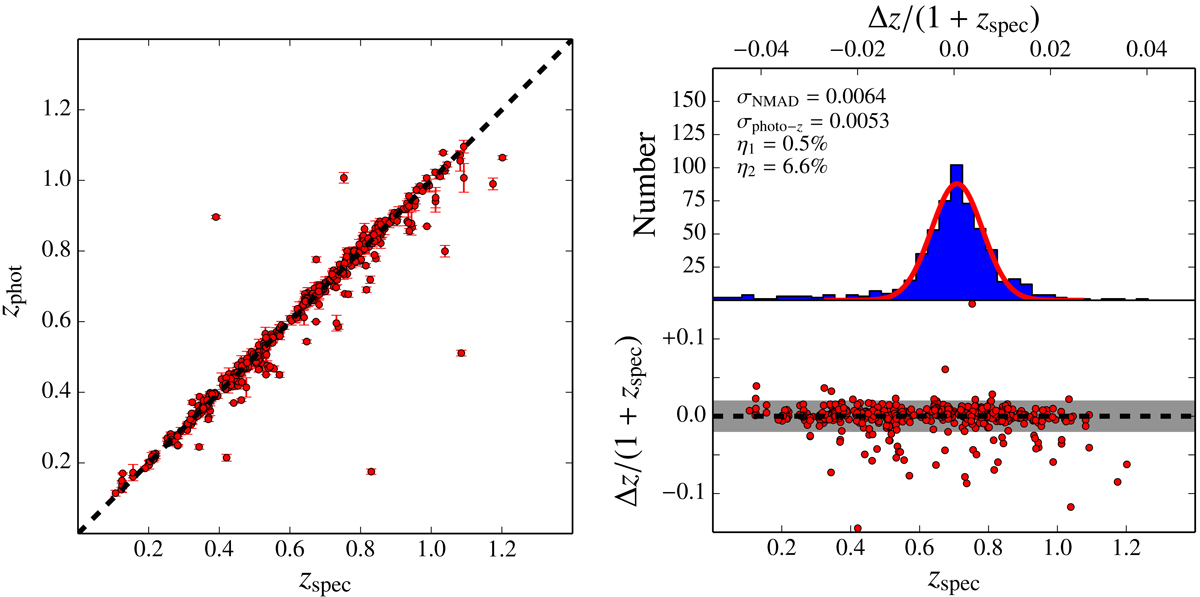
Comparison between the photo-z provided by MUFFIT (zphot) and their spectroscopic values (zspec) for 576 shared quiescent galaxies. Left panel: one-to-one comparison of redshifts, where dashed black line is the one-to-one relation. Top right: histogram of values Δz/(1 + zspec), along with the Gaussian that best fits this distribution (red solid line) and the photo-z accuracy estimators defined in the text (Eqs. (5)–(7)). Bottom right: differences Δz/(1 + zspec) as a function of the spectroscopic redshift (X-axis). The shaded region illustrates the 3 × σNMAD uncertainty.
Current usage metrics show cumulative count of Article Views (full-text article views including HTML views, PDF and ePub downloads, according to the available data) and Abstracts Views on Vision4Press platform.
Data correspond to usage on the plateform after 2015. The current usage metrics is available 48-96 hours after online publication and is updated daily on week days.
Initial download of the metrics may take a while.