Fig. 2.
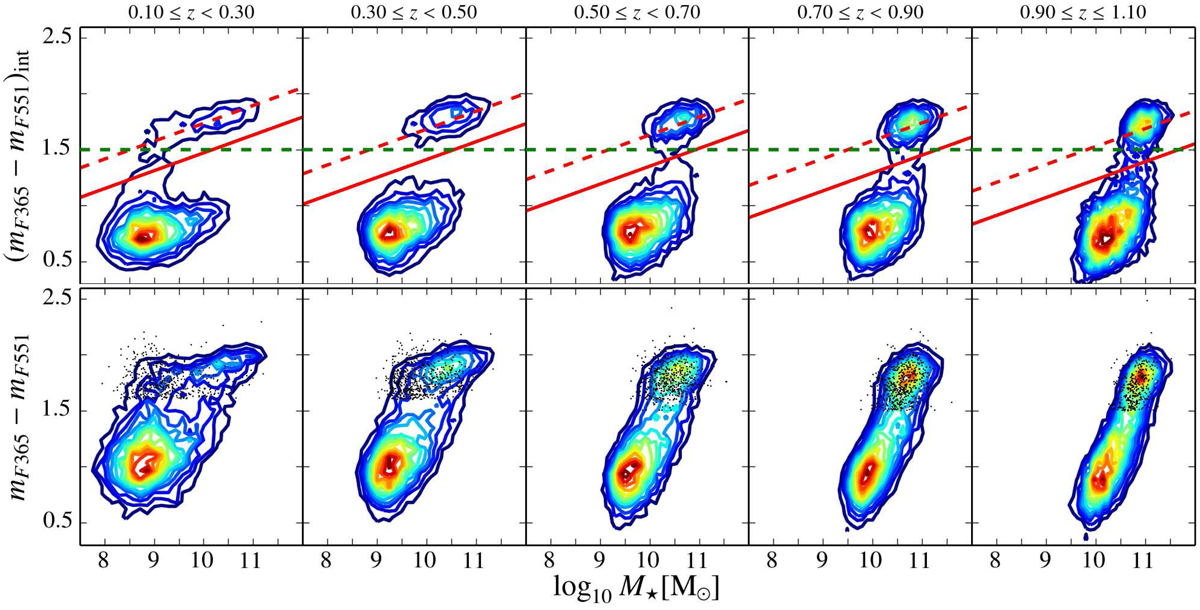
Density surface and distribution of stellar mass vs. rest-frame colour (mF365 − mF551) for galaxies from the ALHAMBRA survey using BC03 SSP models. Top: rest-frame intrinsic colour (mF365 − mF551)int (Y-axis) after correcting for extinction at different redshift. Bottom: rest-frame colours without removing dust effects. Redder (bluer) density-curve colours are related to high (low) densities. Dashed green lines in the top panels illustrate the limiting value (mF365 − mF551)int = 1.5 used for selecting quiescent galaxies in Sect. 4.1. Dashed and solid red lines show the fit to the quiescent sequence, ![]() , and the limiting intrinsic colours,
, and the limiting intrinsic colours, ![]() , values of quiescent galaxies respectively (see details in Sect. 4.2). Black dots in the bottom panels are galaxies labelled as quiescent with the UVJ criteria of Moresco et al. (2013) that lie in the star-forming region after removing extinction effects.
, values of quiescent galaxies respectively (see details in Sect. 4.2). Black dots in the bottom panels are galaxies labelled as quiescent with the UVJ criteria of Moresco et al. (2013) that lie in the star-forming region after removing extinction effects.
Current usage metrics show cumulative count of Article Views (full-text article views including HTML views, PDF and ePub downloads, according to the available data) and Abstracts Views on Vision4Press platform.
Data correspond to usage on the plateform after 2015. The current usage metrics is available 48-96 hours after online publication and is updated daily on week days.
Initial download of the metrics may take a while.