Fig. D.5.
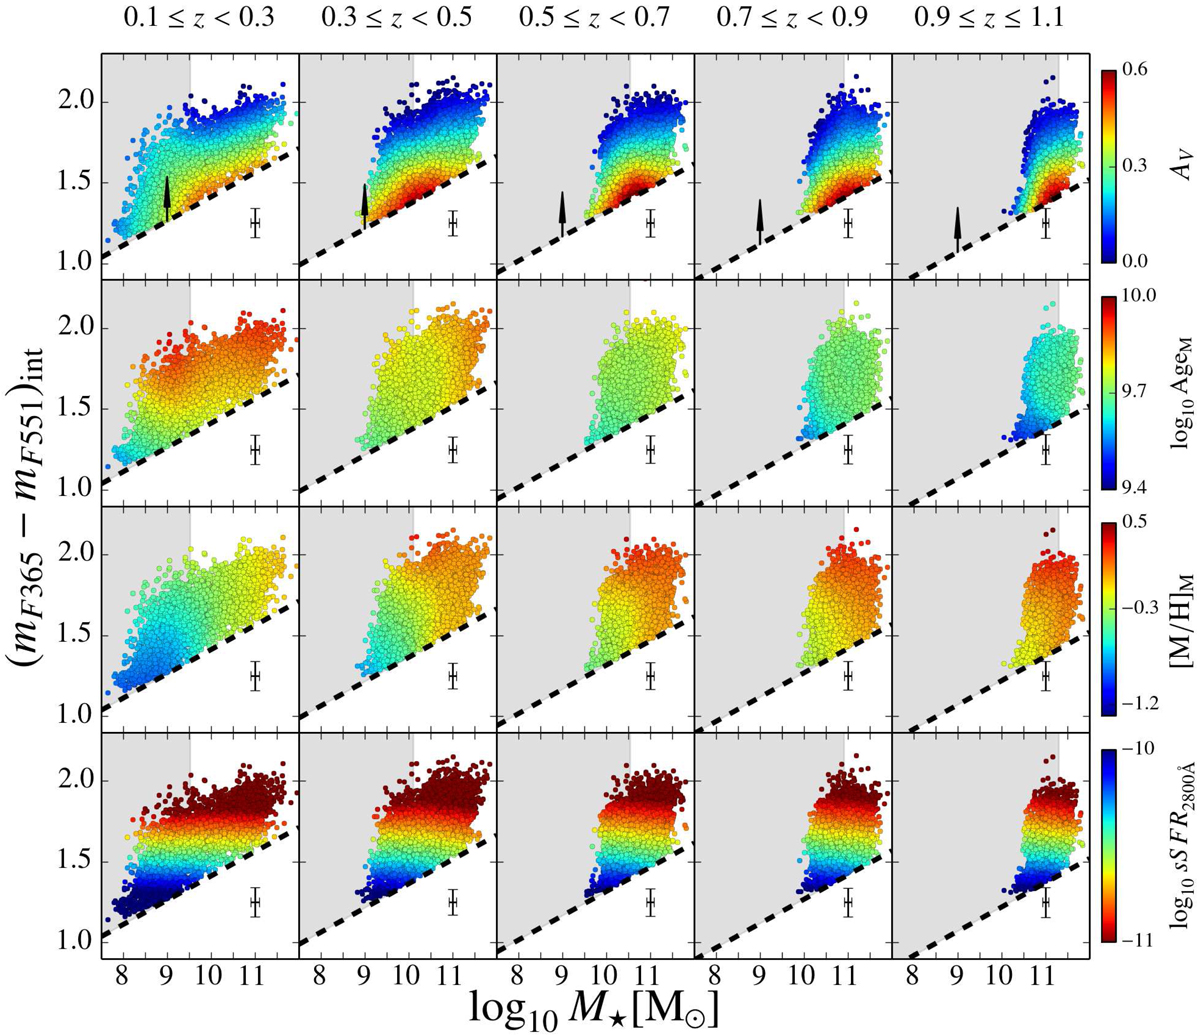
Stellar population parameters in the rest-frame stellar mass–colour diagram. At different redshift bins, we present the stellar mass (X-axis) and intrinsic colour (mF365 − mF551)int (Y-axis) after correcting for extinction. The stellar population parameters are colour-coded according to their values using EMILES+BaSTI SSP models (see colour bars). From top to bottom: extinction, mass-weighted age and metallicity, and specific star formation rate. All the parameters were spatially averaged through a LOESS method. Black crosses illustrate the median uncertainties in both stellar mass and (mF365 − mF551)int intrinsic colour. The dashed line illustrates the colour limit for selecting quiescent galaxies in the MCDE, see Eq. (3) and Table 3, for this work. The shaded regions show the stellar mass range in which our quiescent sample is not complete in stellar mass. We illustrate the colour variations owing to a reddening of AV = 0.5 (black arrow), assuming the extinction law of Fitzpatrick (1999).
Current usage metrics show cumulative count of Article Views (full-text article views including HTML views, PDF and ePub downloads, according to the available data) and Abstracts Views on Vision4Press platform.
Data correspond to usage on the plateform after 2015. The current usage metrics is available 48-96 hours after online publication and is updated daily on week days.
Initial download of the metrics may take a while.