Free Access
Fig. A.1.
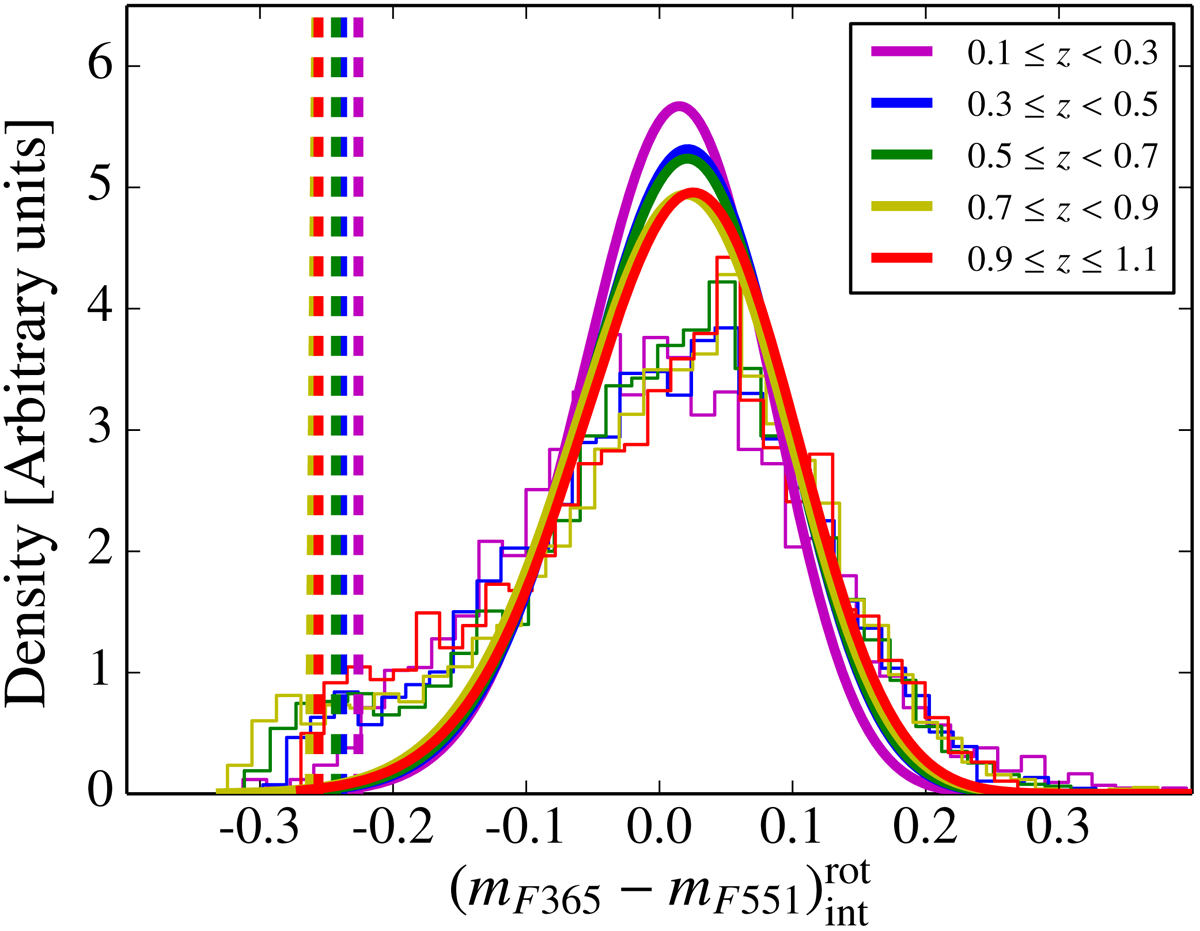
Histogram of the ![]() values (see Eq. (2)) for the quiescent sample (intrinsic red galaxies) at different redshifts using the BC03 SSP models. Solid lines illustrate the MLE best fit of the
values (see Eq. (2)) for the quiescent sample (intrinsic red galaxies) at different redshifts using the BC03 SSP models. Solid lines illustrate the MLE best fit of the ![]() distribution at different redshifts. Dashed coloured lines show the upper 3σ limit of the distributions provided by the MLE method.
distribution at different redshifts. Dashed coloured lines show the upper 3σ limit of the distributions provided by the MLE method.
Current usage metrics show cumulative count of Article Views (full-text article views including HTML views, PDF and ePub downloads, according to the available data) and Abstracts Views on Vision4Press platform.
Data correspond to usage on the plateform after 2015. The current usage metrics is available 48-96 hours after online publication and is updated daily on week days.
Initial download of the metrics may take a while.