Fig. 11.
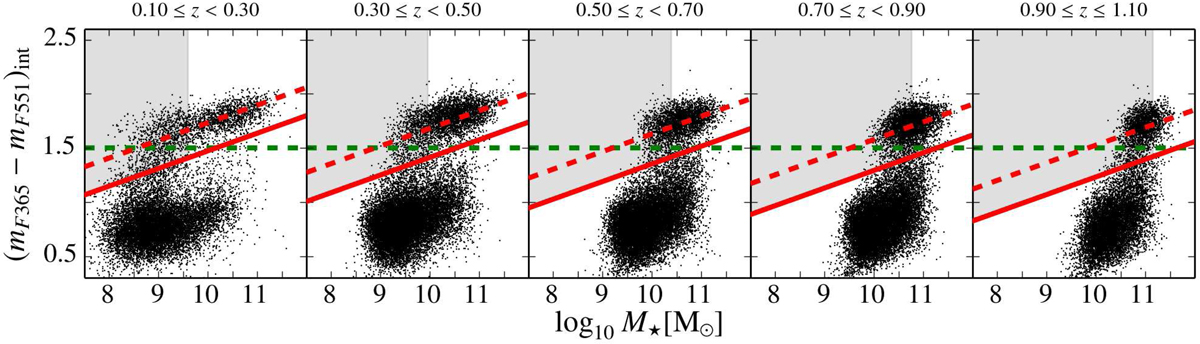
Galaxies from the ALHAMBRA survey (black dots) in the rest-frame stellar mass–colour diagram corrected for extinction (MCDE) at different redshift bins. The shaded region illustrates the stellar mass range in which our sample of quiescent galaxies is not complete in stellar mass (see Sect. 4.5) at each redshift bin. The dashed green line shows the limiting value (mF365 − mF551)int = 1.5 used to select quiescent galaxies in Sect. 4.1. The dashed red line exhibits the main sequence of quiescent galaxies in the MCDE, see Eq. (3) and Table 3, and the solid line is the limiting colour value used to select quiescent galaxies in this diagram, see Eq. (3) and Table 3. The stellar population predictions were obtained through BC03 SSP models.
Current usage metrics show cumulative count of Article Views (full-text article views including HTML views, PDF and ePub downloads, according to the available data) and Abstracts Views on Vision4Press platform.
Data correspond to usage on the plateform after 2015. The current usage metrics is available 48-96 hours after online publication and is updated daily on week days.
Initial download of the metrics may take a while.