Fig. 8
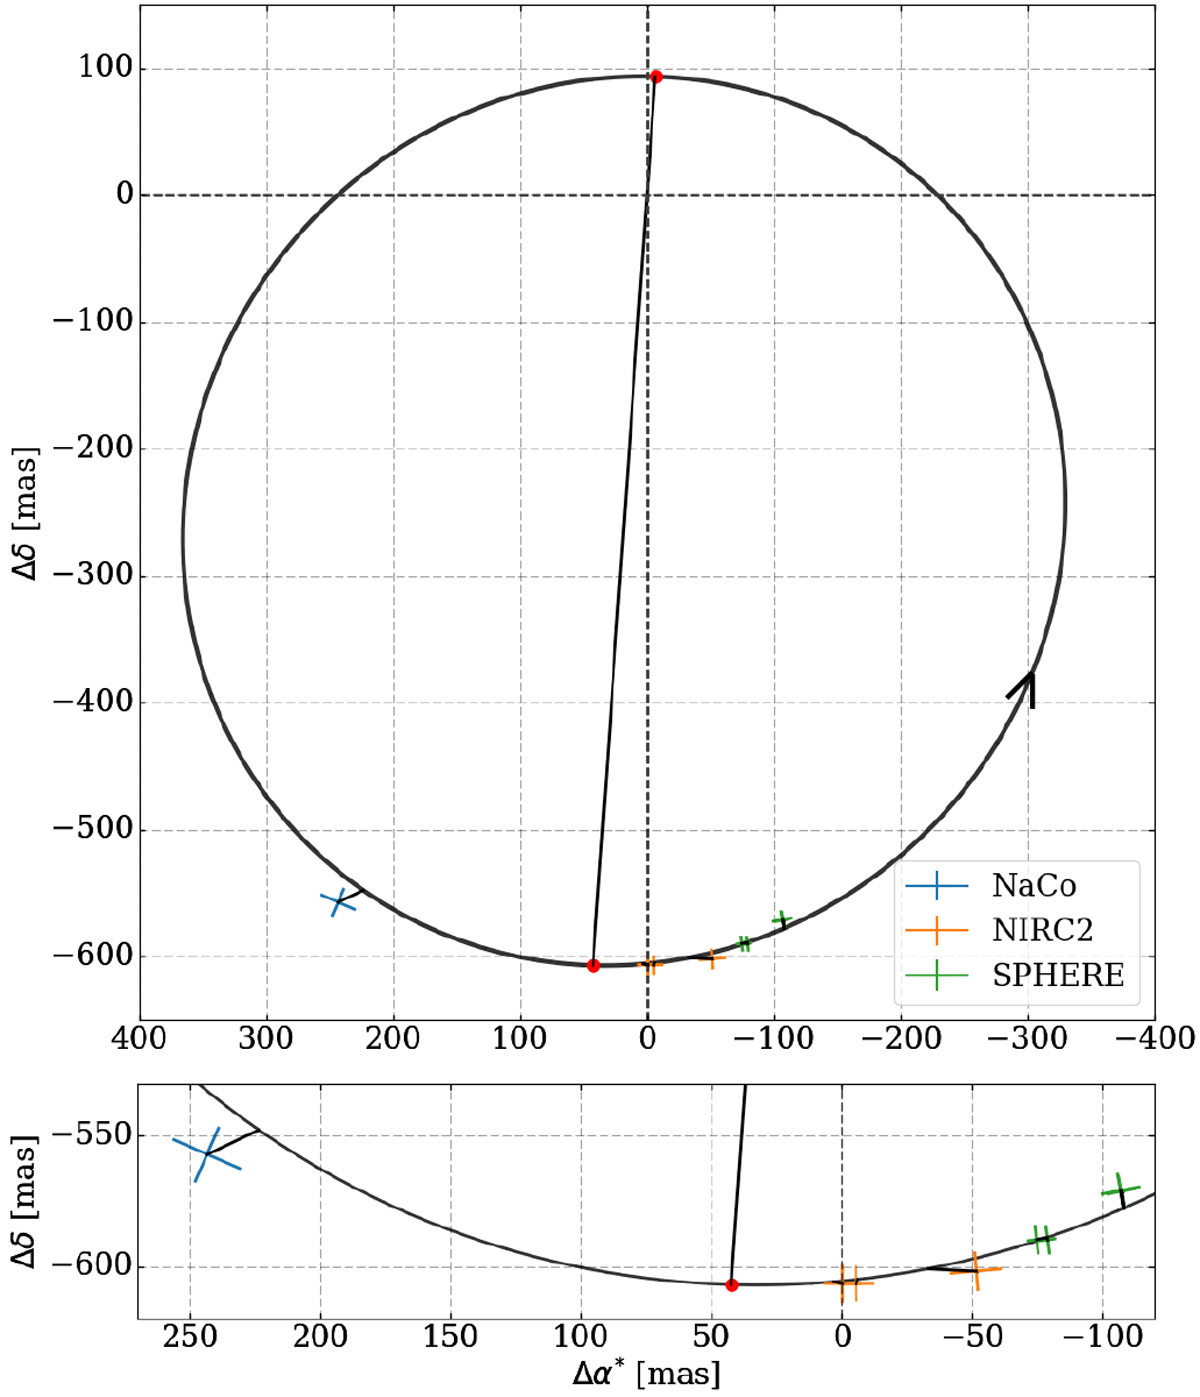
Relative orbit of the HD 4747AB system. The black curve corresponds to the maximum likelihood of the combined RV and direct imaging MCMC analysis. The NaCo data point is shown in blue, the NIRC2 Ks and L′ observationsfrom Crepp et al. (2016) in yellow, and the SPHERE ones in green. The arrow shows the orbit rotational direction and the red dots show apastron and periastron.
Current usage metrics show cumulative count of Article Views (full-text article views including HTML views, PDF and ePub downloads, according to the available data) and Abstracts Views on Vision4Press platform.
Data correspond to usage on the plateform after 2015. The current usage metrics is available 48-96 hours after online publication and is updated daily on week days.
Initial download of the metrics may take a while.