Fig. 6.
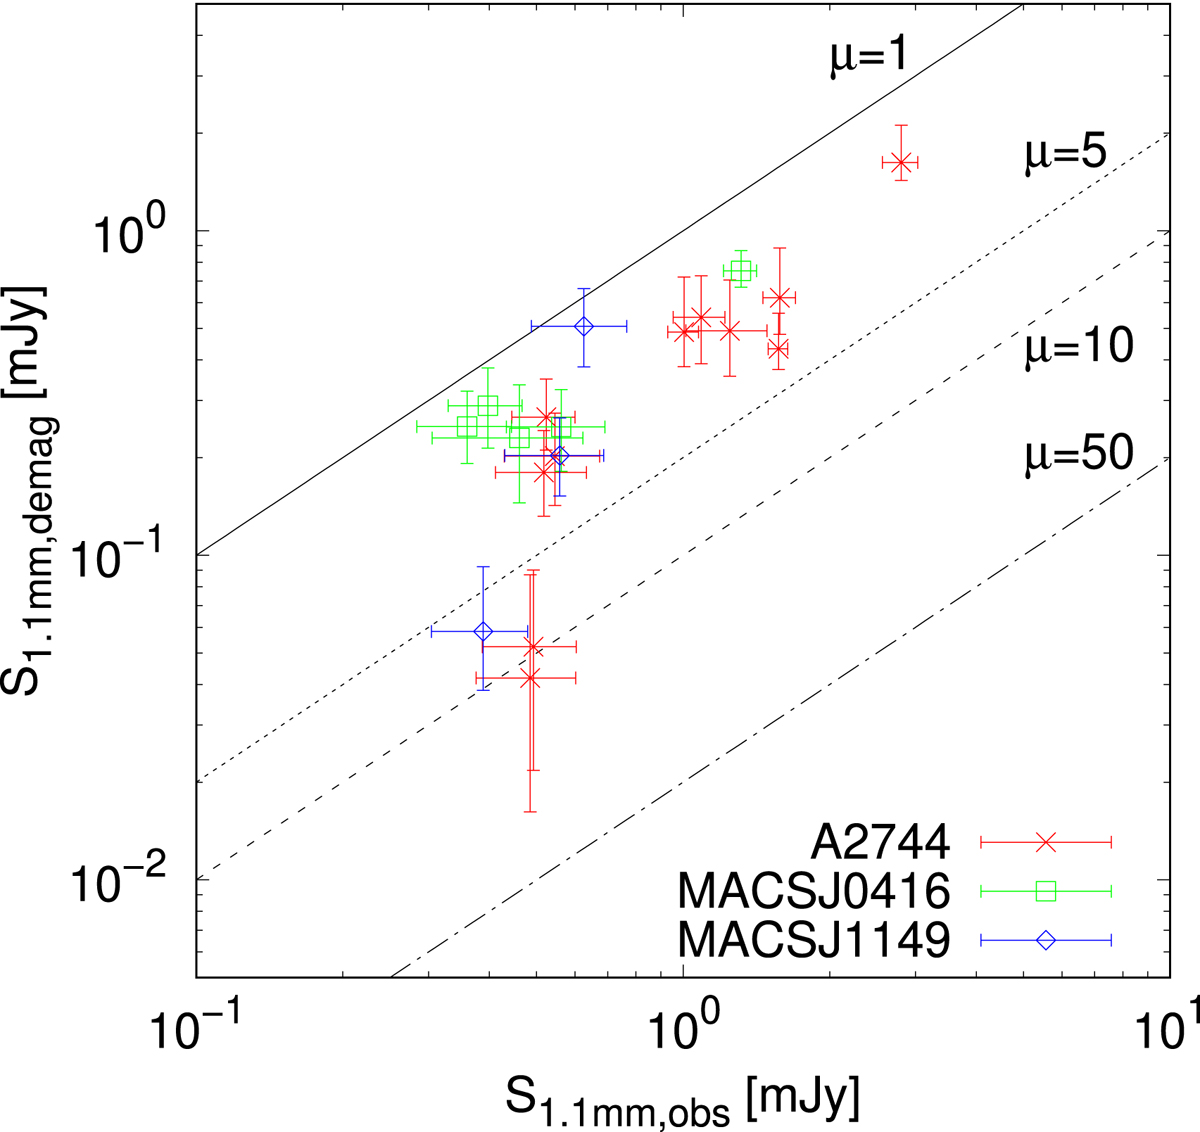
Median demagnified integrated flux density as function of observed integrated flux density for A2744 (red crosses), MACS J0416 (green squares), and MACS J1149 (blue diamonds). Median values were obtained by combining all models for each cluster field. Error bars in demagnified fluxes correspond to the 16th and 84th percentiles, while for observed fluxes, there are 1σ statistical uncertainties. As a reference, black lines indicate magnification values of one (solid), five (dotted), ten (dashed), and 50 (dot-dashed).
Current usage metrics show cumulative count of Article Views (full-text article views including HTML views, PDF and ePub downloads, according to the available data) and Abstracts Views on Vision4Press platform.
Data correspond to usage on the plateform after 2015. The current usage metrics is available 48-96 hours after online publication and is updated daily on week days.
Initial download of the metrics may take a while.