Fig. 6.
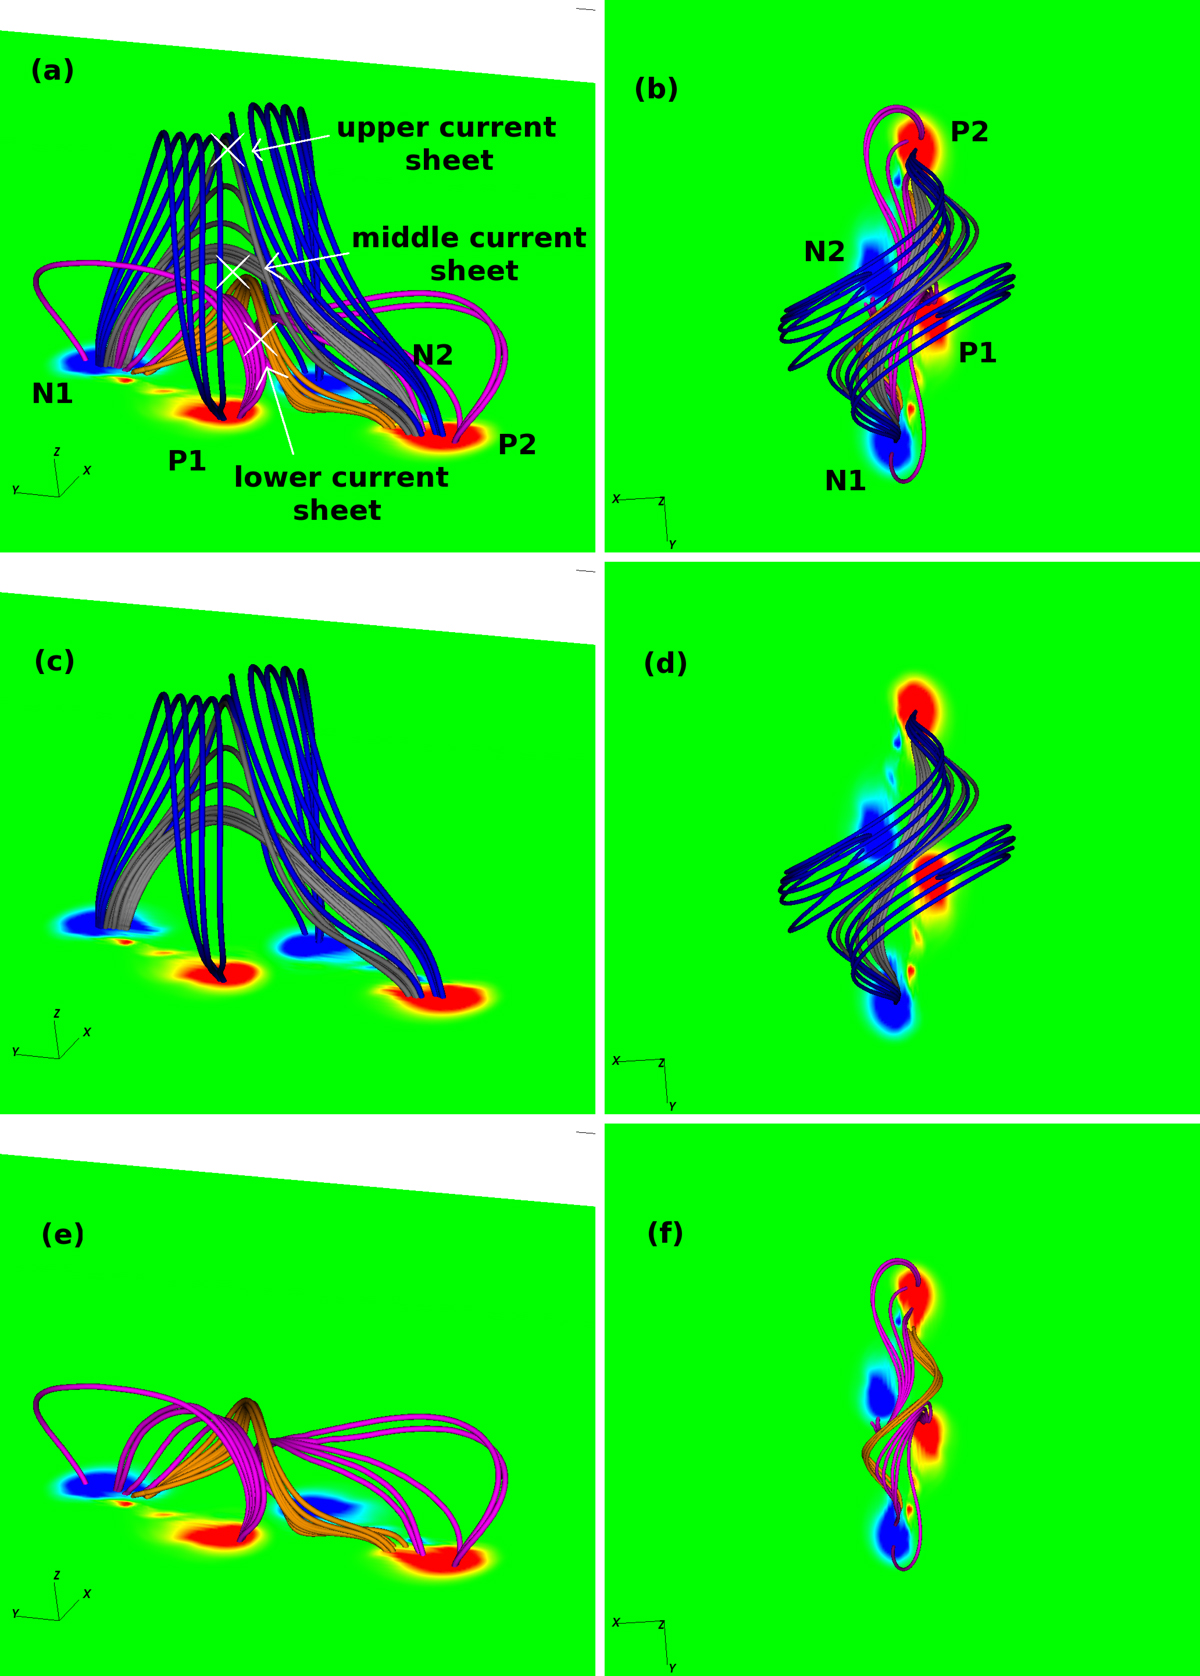
Overall magnetic field line topology before the first eruption t = 274 min ((a) side view, (b) top view). The white crosses indicate the locations at which the current sheets are formed. Panels c and d: focus on the upper part of the field line system. Blue field lines are part of the magnetic field lobes traced around z = 13 Mm. The grey field lines result from the reconnection between blue field lines. Panels e and f: lower part of the magnetic field line system. Pink field lines are lower-lying sheared field lines of the magnetic lobes. The orange field lines result from the reconnection between pink field lines. The blue-red patches at the photospheric plane show the negative-positive Bz component of the magnetic field saturated at ±300 G.
Current usage metrics show cumulative count of Article Views (full-text article views including HTML views, PDF and ePub downloads, according to the available data) and Abstracts Views on Vision4Press platform.
Data correspond to usage on the plateform after 2015. The current usage metrics is available 48-96 hours after online publication and is updated daily on week days.
Initial download of the metrics may take a while.