Fig. 18.
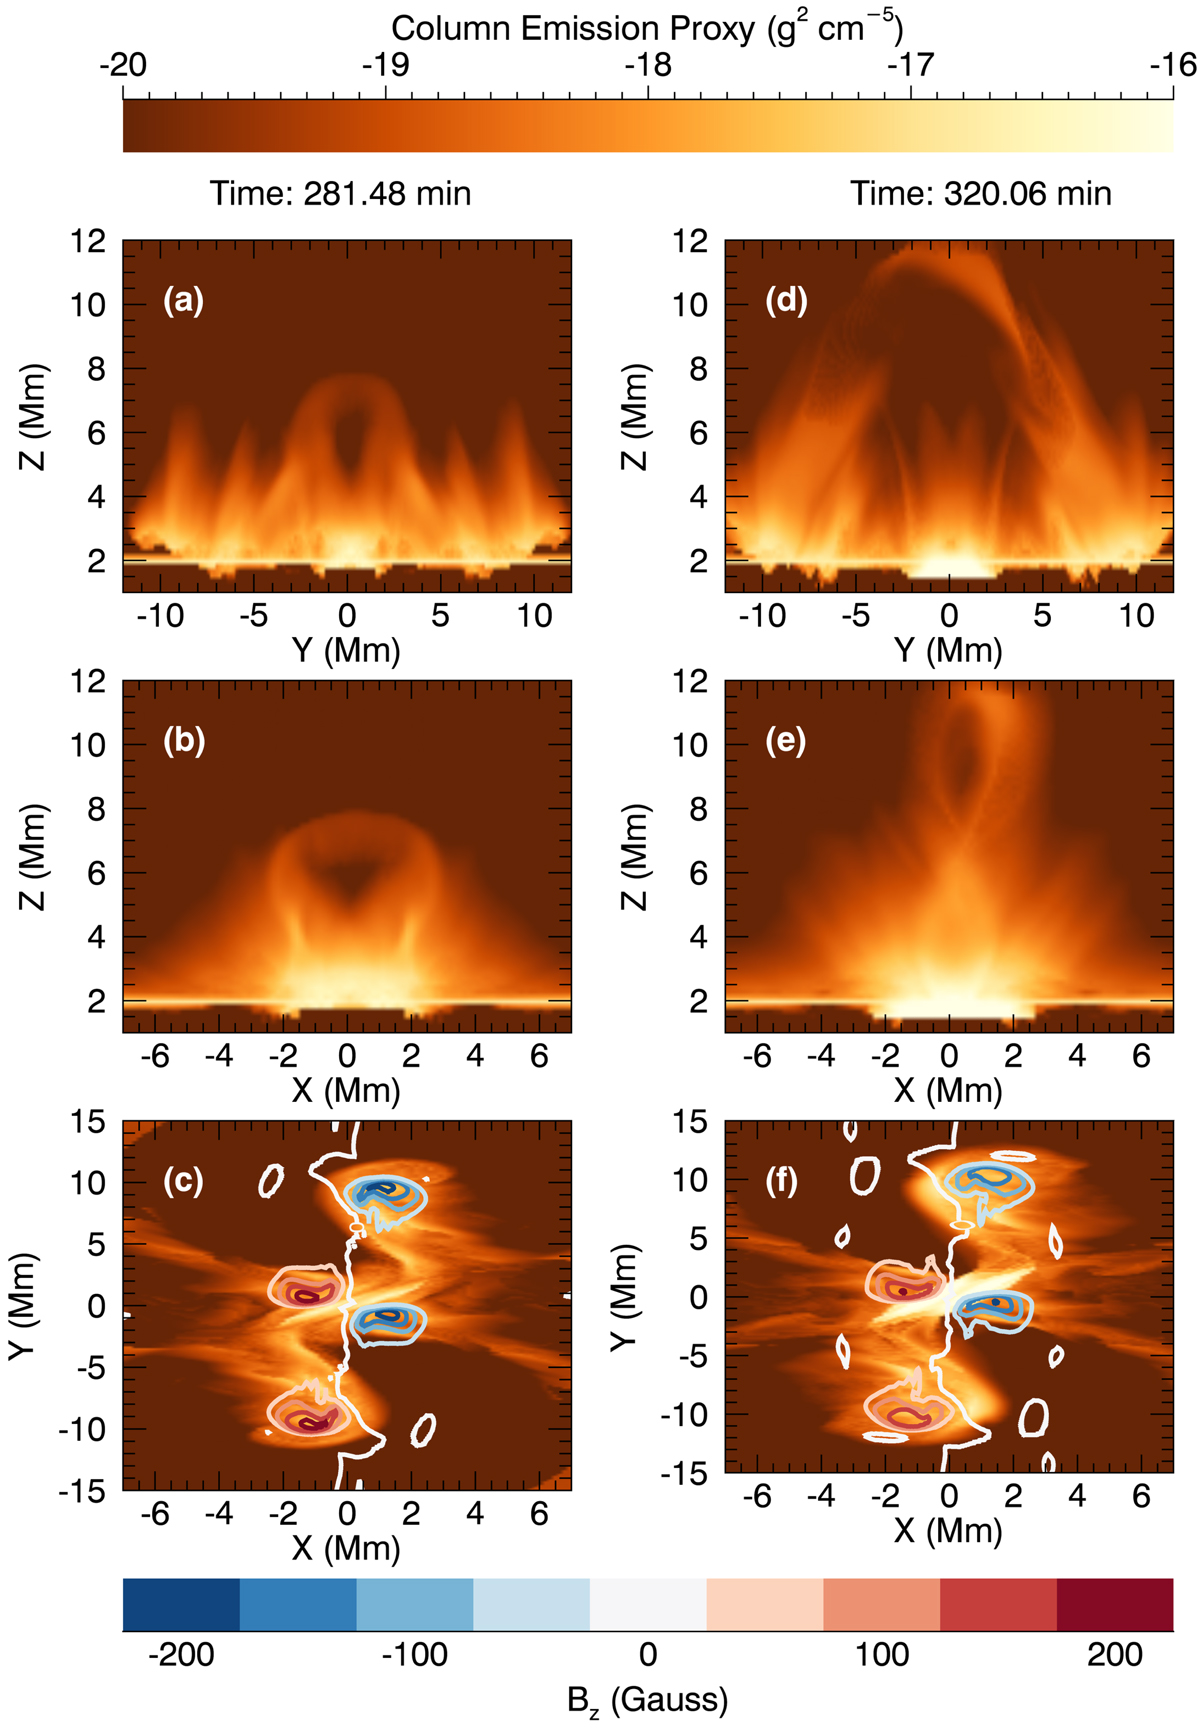
Emission proxy images for the cooler temperature range (30 000 − 300 000 K) for the first eruption at t = 285.8 min (left column) and the second eruption at t = 320.1 min (right column). The upper, middle, and lower panels correspond to integrating over the x, y, and z lines of sight, respectively. The Bz magnetic field contours at the photosphere are overlaid in the lower panel.
Current usage metrics show cumulative count of Article Views (full-text article views including HTML views, PDF and ePub downloads, according to the available data) and Abstracts Views on Vision4Press platform.
Data correspond to usage on the plateform after 2015. The current usage metrics is available 48-96 hours after online publication and is updated daily on week days.
Initial download of the metrics may take a while.