Fig. 9.
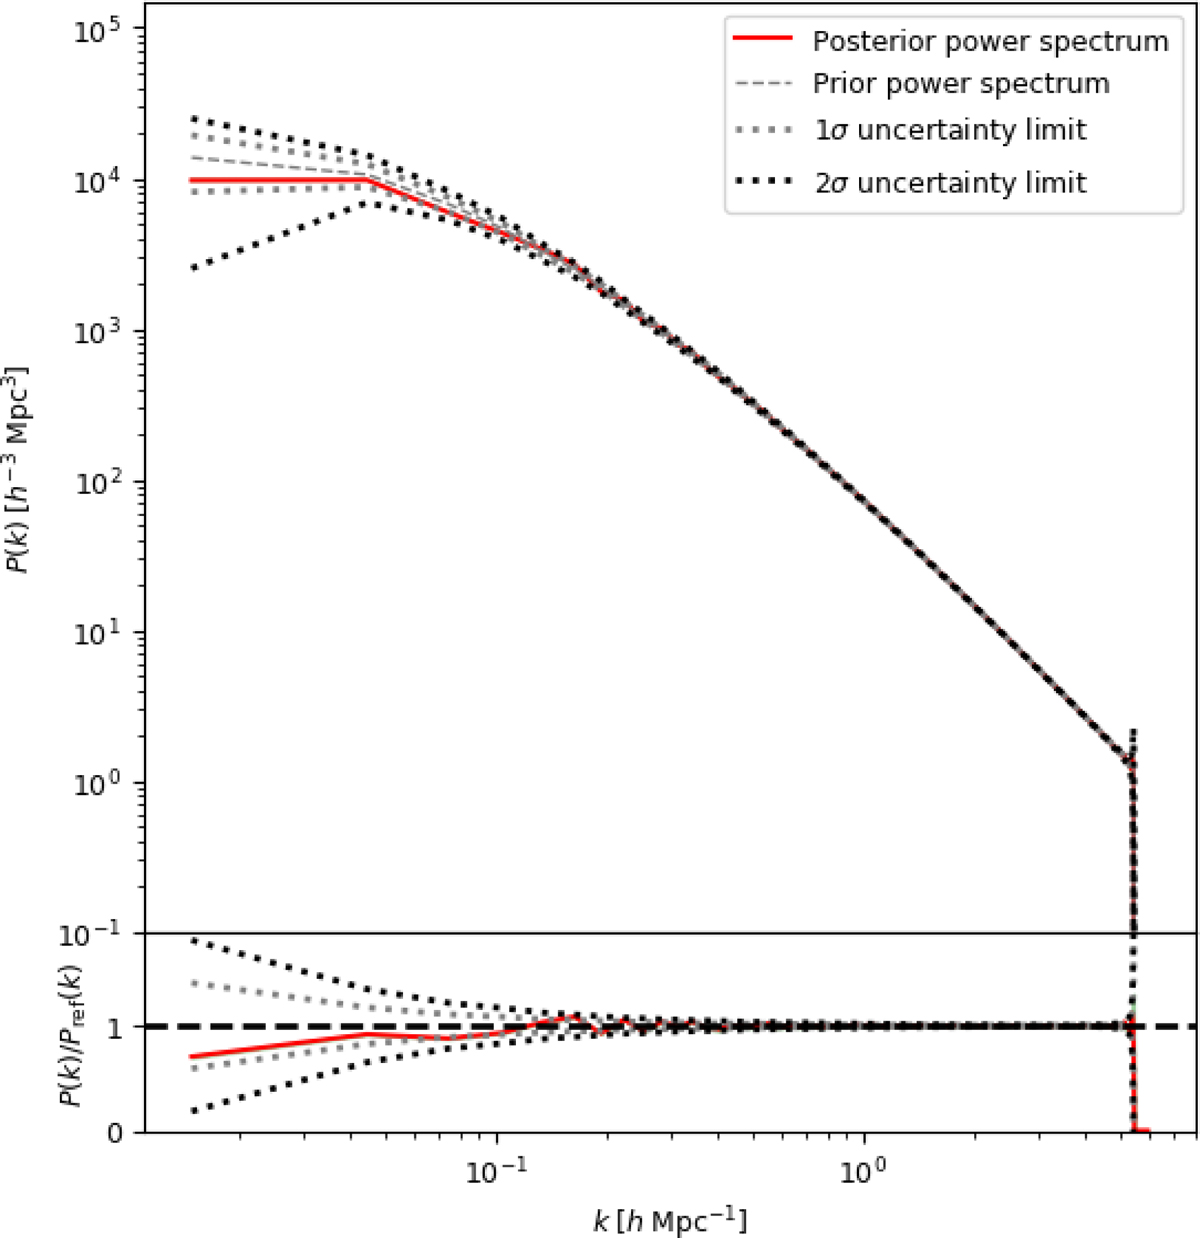
Mean posterior matter power-spectrum. The mean and standard deviation of the matter power spectrum have been computed from 8060 density samples of the Markov chain obtained after the warm-up phase shown in Fig. 2. Although the standard deviation is plotted, it is too small to be seen, showing the stability of the posterior power-spectrum. The dashed line indicates the underlying power spectrum and the 1- and 2-σ cosmic variance limit. The algorithm recovers the power-spectrum amplitudes within the 1-σ cosmic variance uncertainty limit throughout the entire range of Fourier modes considered in this work.
Current usage metrics show cumulative count of Article Views (full-text article views including HTML views, PDF and ePub downloads, according to the available data) and Abstracts Views on Vision4Press platform.
Data correspond to usage on the plateform after 2015. The current usage metrics is available 48-96 hours after online publication and is updated daily on week days.
Initial download of the metrics may take a while.