Fig. 5.
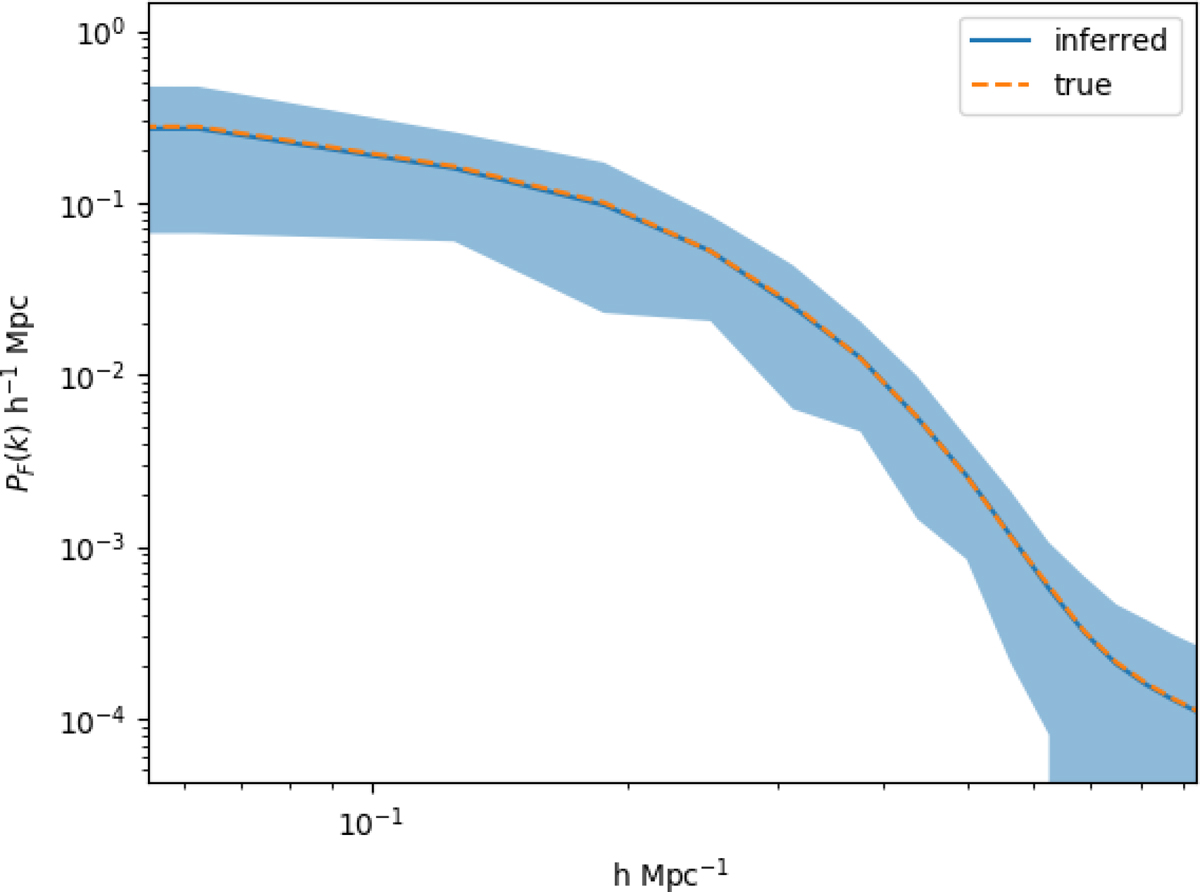
One-dimensional power spectrum of the flux. The orange line corresponds to the mean flux power spectrum computed from posterior-predicted spectra. The blue-shaded region corresponds to the standard deviation between the different lines of sight. The blue line indicates the flux power spectrum for the mock data. This test shows that the algorithm recovers the flux spectrum inside the 1-σ uncertainty limit.
Current usage metrics show cumulative count of Article Views (full-text article views including HTML views, PDF and ePub downloads, according to the available data) and Abstracts Views on Vision4Press platform.
Data correspond to usage on the plateform after 2015. The current usage metrics is available 48-96 hours after online publication and is updated daily on week days.
Initial download of the metrics may take a while.