Fig. 4.
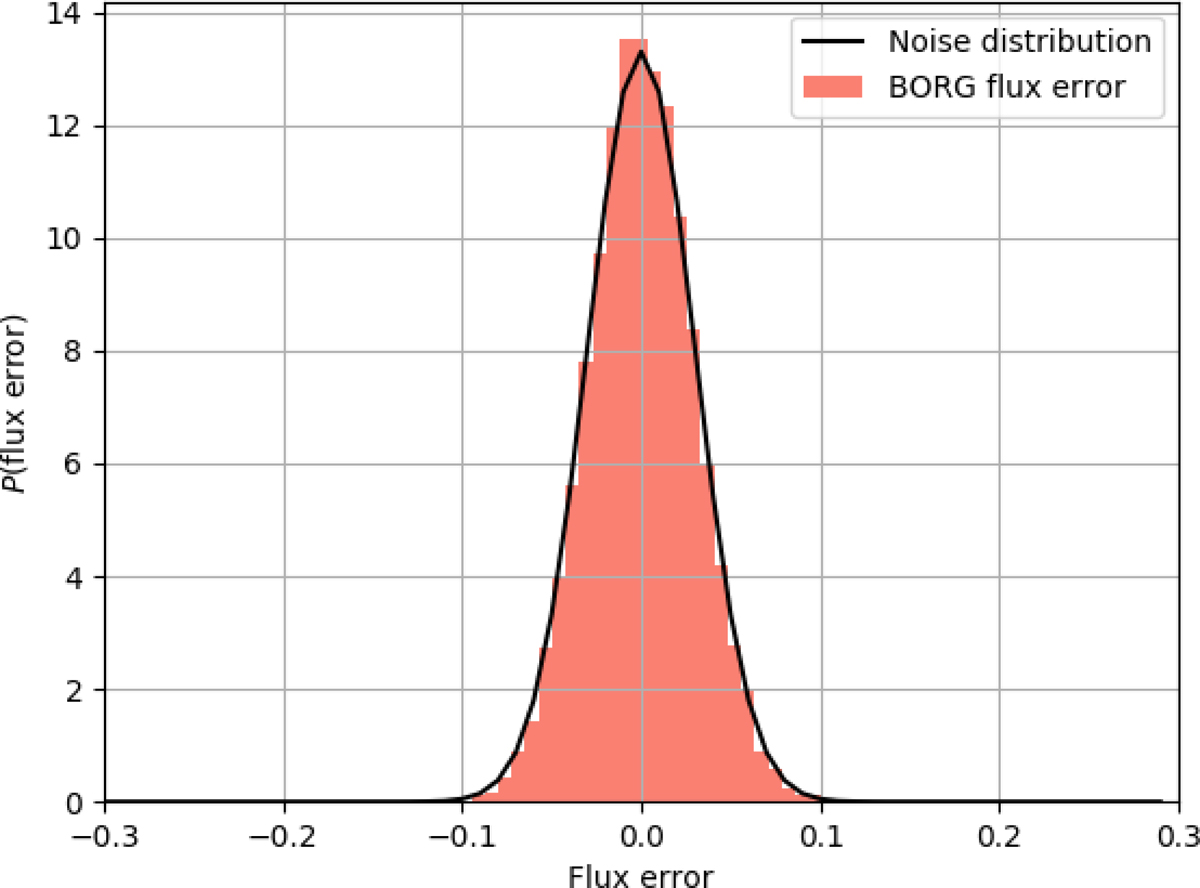
Histogram of the error in the fractional transmitted flux, which is computed as the difference between posterior-predicted fluxes and input spectra. The distribution of flux error matches the distribution of pixel noise in the data, indicating that the method is close to the theoretical optimum. This distribution of error flux can be compared to the one obtained in previous works, demonstrating that our method recovers the fluxes with significantly higher accuracy.
Current usage metrics show cumulative count of Article Views (full-text article views including HTML views, PDF and ePub downloads, according to the available data) and Abstracts Views on Vision4Press platform.
Data correspond to usage on the plateform after 2015. The current usage metrics is available 48-96 hours after online publication and is updated daily on week days.
Initial download of the metrics may take a while.