Fig. 2.
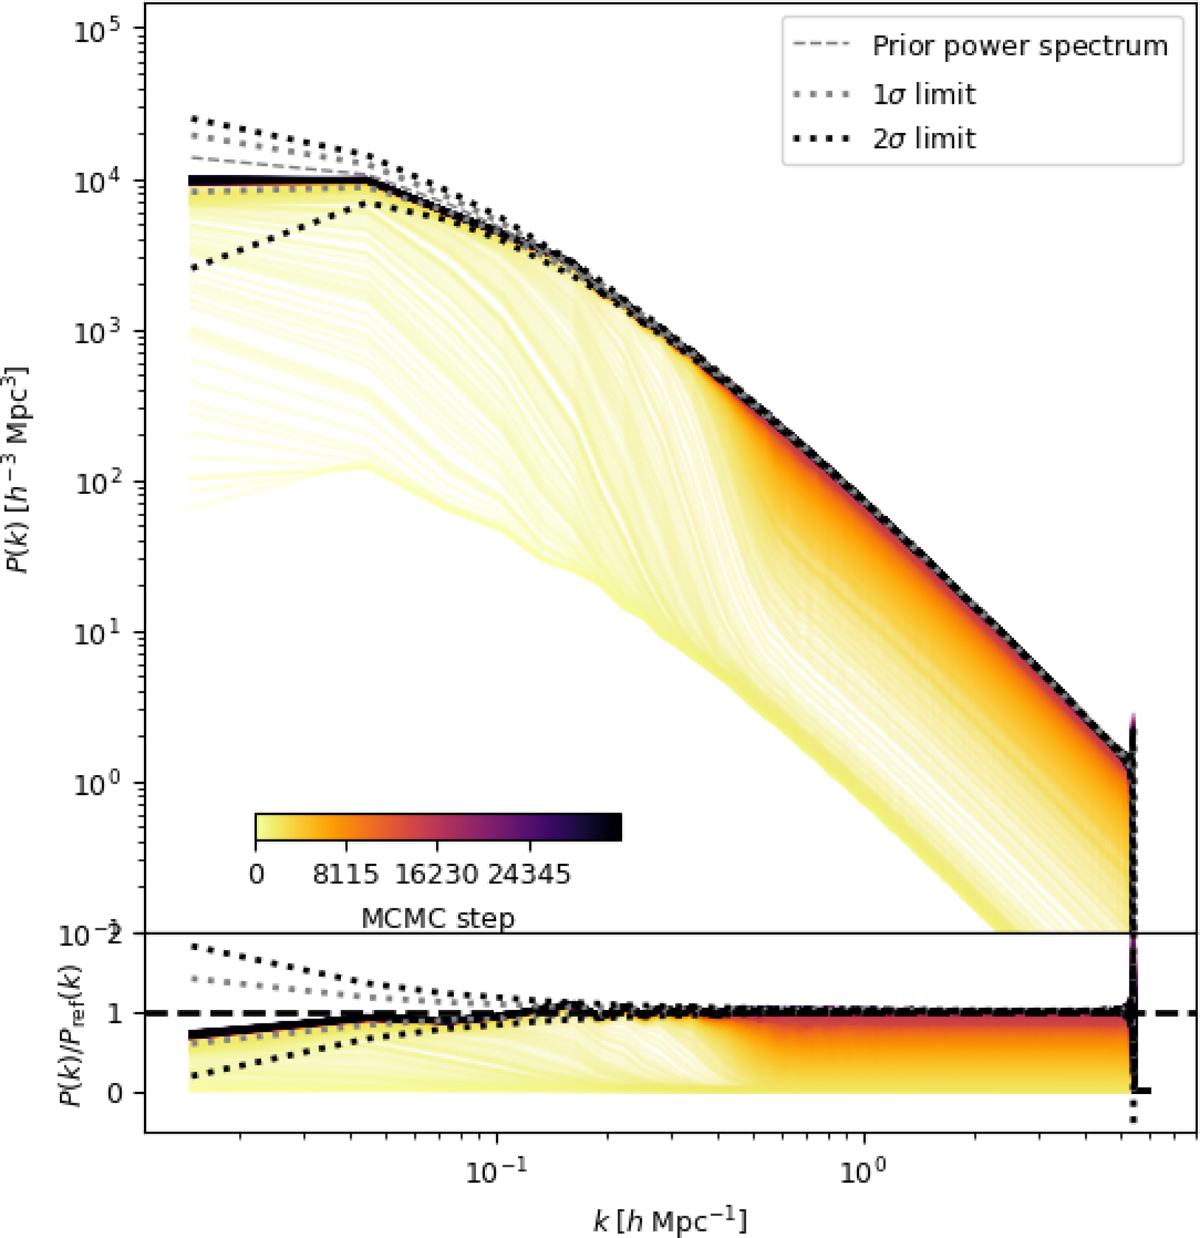
Burn-in of the posterior matter power spectra from the inferred initial conditions from a BORG analysis. The colour scale shows the evolution of the matter power spectrum with the number of samples: the Markov chain is initialized with a Gaussian initial density field scaled by a factor 10−3 and the amplitudes of the power spectrum systematically drift towards the fiducial values. Monitoring this drift allows us to identify when the Markov chain approaches a stationary distribution and provides unbiased estimates of the target distribution. The dashed lines indicate the underlying power spectrum and the 1- and 2-σ cosmic variance limits. At the end of the warm-up phase, the algorithm recovers the true matter power spectrum in all range of Fourier modes.
Current usage metrics show cumulative count of Article Views (full-text article views including HTML views, PDF and ePub downloads, according to the available data) and Abstracts Views on Vision4Press platform.
Data correspond to usage on the plateform after 2015. The current usage metrics is available 48-96 hours after online publication and is updated daily on week days.
Initial download of the metrics may take a while.