Fig. 18.
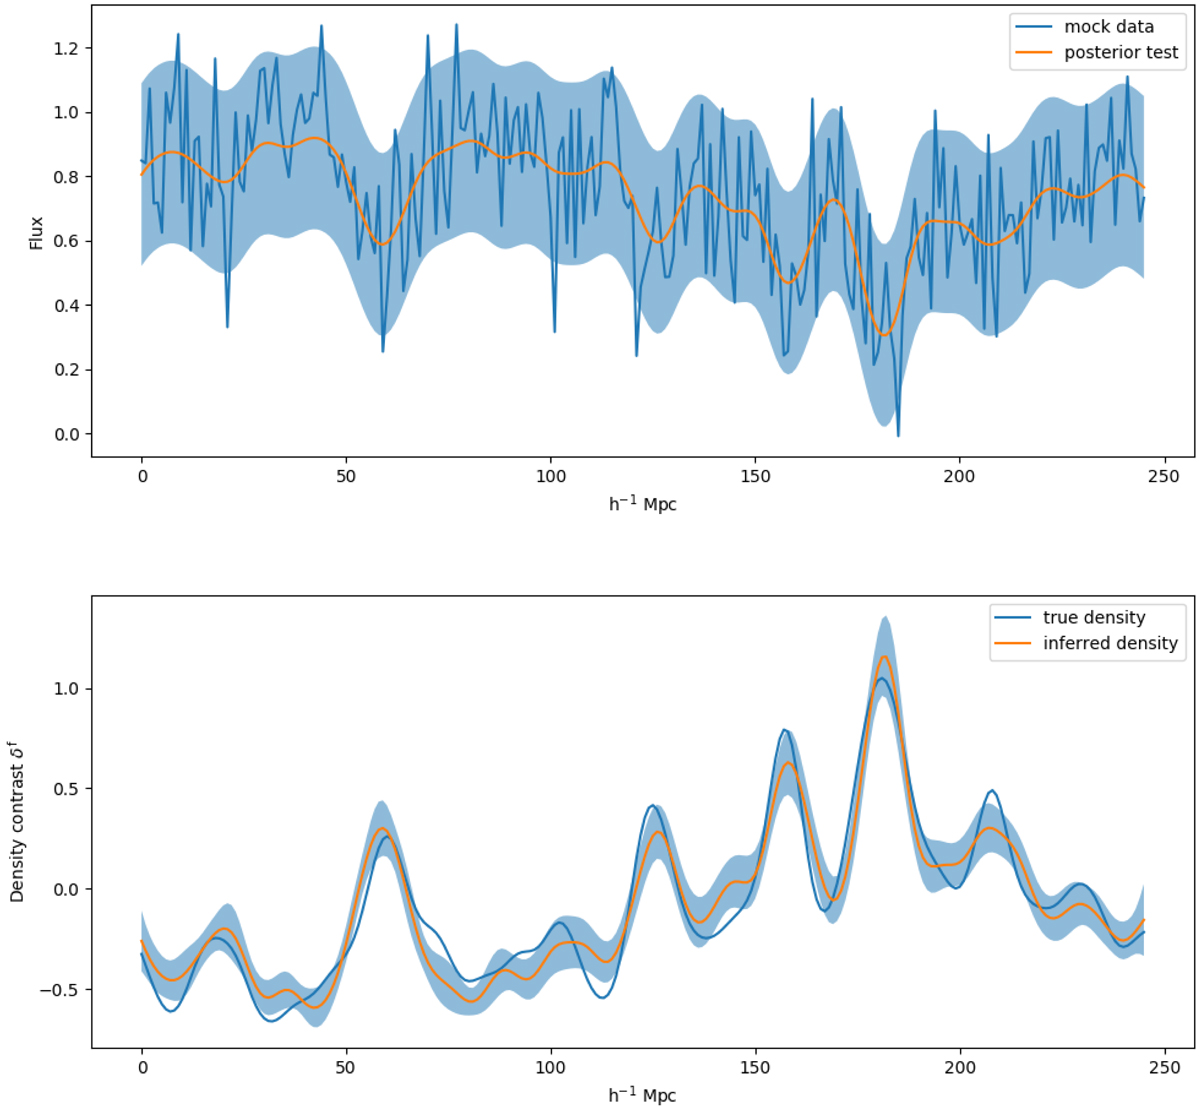
Top panel: posterior predictive flux for a spectrum with S/N = 2. The posterior predicted flux is computed from the ensemble mean density field, shown in the lower panel (orange line). The blue shaded region indicates the 1-σ region, corresponding to the standard deviation of the noise in this line of sight. Our method recovers the transmitted flux fraction correctly, confirming that the data model can accurately account for the observations also in the low S/N regime. Bottom panel: comparison of the inferred ensemble mean density field along the line of sight to the ground truth. The density field has been smoothed with a Gaussian smoothing kernel of σ = 0.5 h−1 Mpc to simulate the difference between dark matter and gas density fields (Peirani et al. 2014). This smoothing kernel is applied to the dark matter density field before generating the mock data.
Current usage metrics show cumulative count of Article Views (full-text article views including HTML views, PDF and ePub downloads, according to the available data) and Abstracts Views on Vision4Press platform.
Data correspond to usage on the plateform after 2015. The current usage metrics is available 48-96 hours after online publication and is updated daily on week days.
Initial download of the metrics may take a while.