Fig. 12.
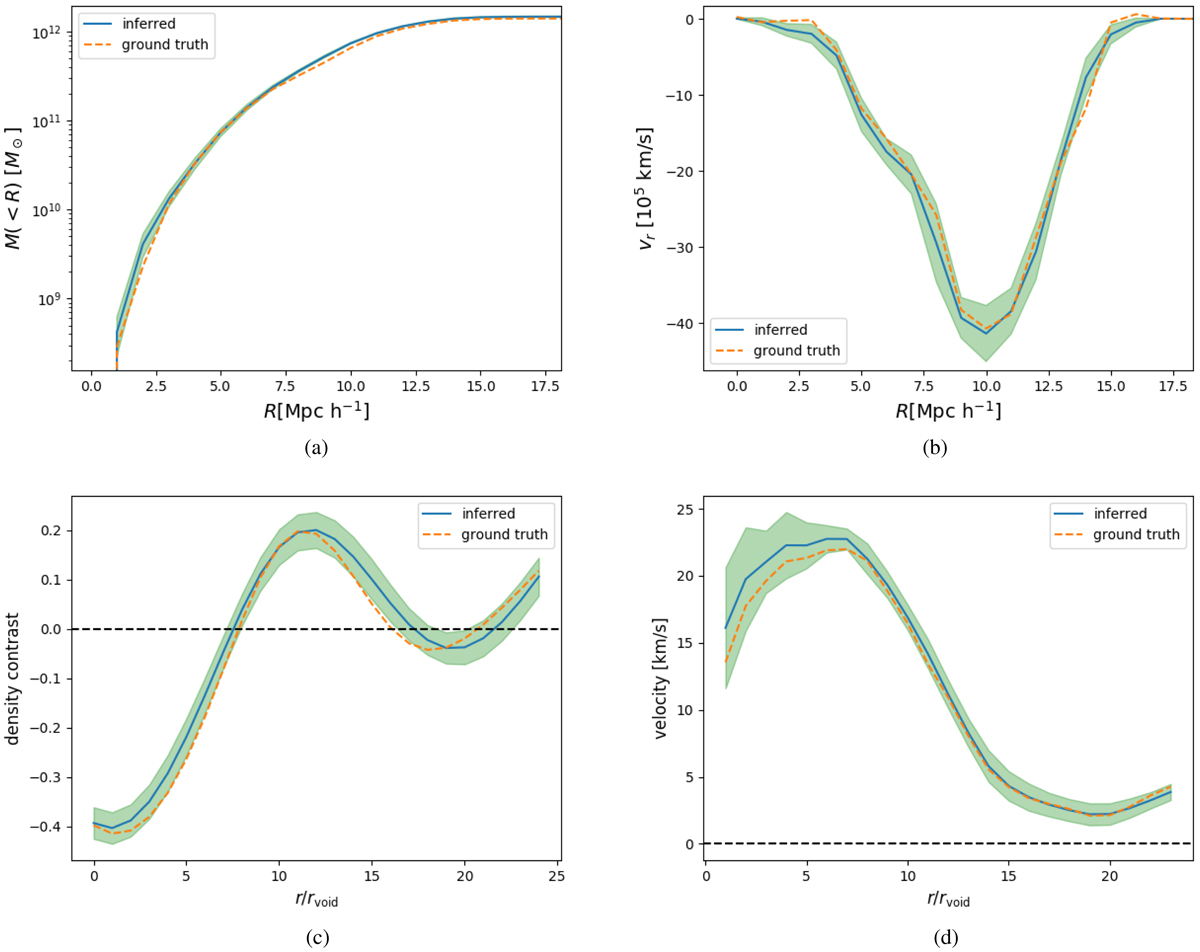
Top: cluster mass (left) and radial velocity (right) profiles from the inferred ensemble mean density field and the simulation. These profiles are computed by averaging over the mass and velocity profiles measured on 60 different density samples. The shaded regions show the standard deviation between these samples. The structured is traversed by 4 lines of sight with a Gaussian noise distribution of σ = 0.03. The algorithm recovers the correct mass profile from the simulation. This demonstrates that the method provides unbiased mass estimates, correcting for the astrophysical bias of the IGM. Bottom: spherically averaged density (left) and velocity (right) profiles of a void, obtained by averaging the void profile measured in 60 density samples. The standard deviation between the samples is shown as the shaded region. This void is traversed by 6 lines of sight with a Gaussian noise distribution of σ = 0.03. These plots show that the method recovers the underlying density and velocity profiles of the simulation.
Current usage metrics show cumulative count of Article Views (full-text article views including HTML views, PDF and ePub downloads, according to the available data) and Abstracts Views on Vision4Press platform.
Data correspond to usage on the plateform after 2015. The current usage metrics is available 48-96 hours after online publication and is updated daily on week days.
Initial download of the metrics may take a while.