Fig. 10.
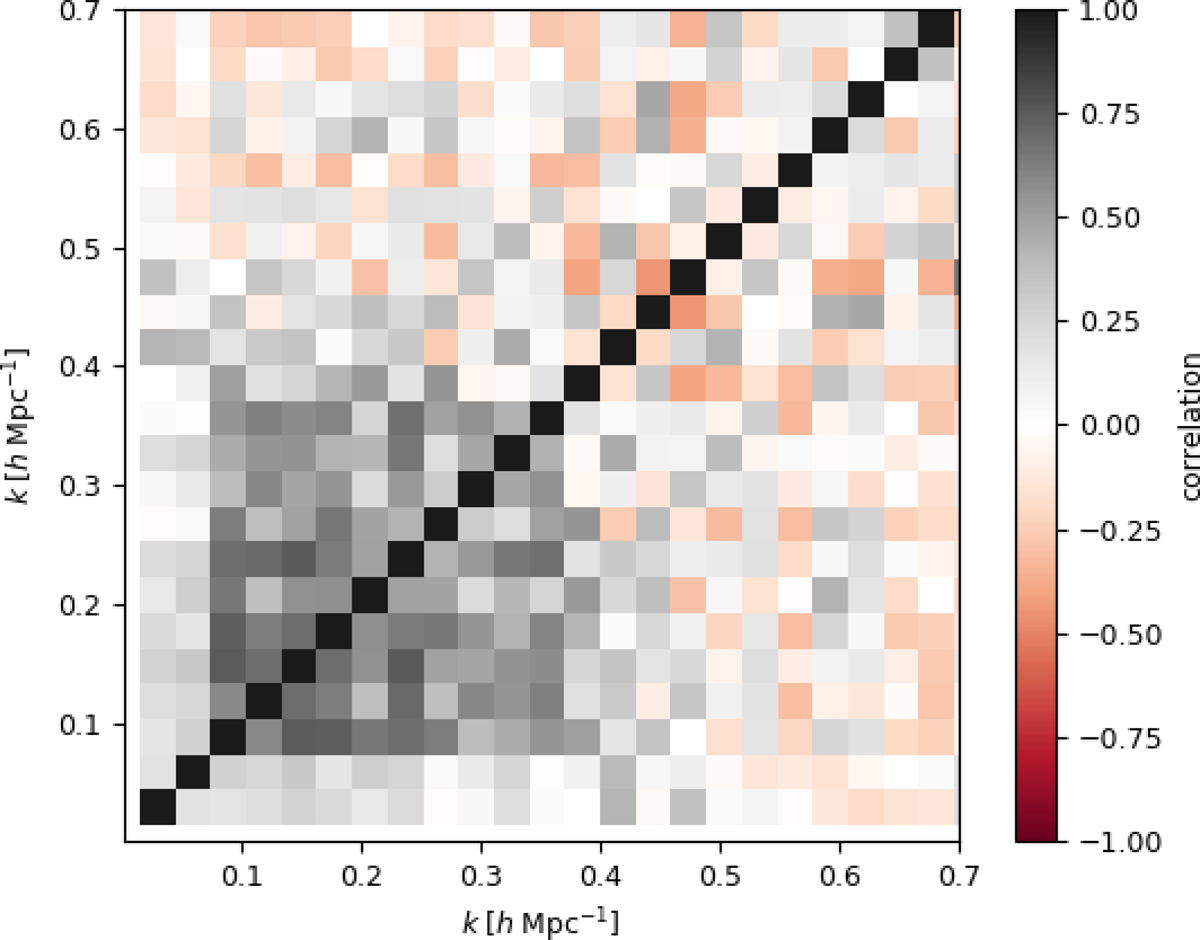
Estimated correlation matrix of power spectrum amplitudes with the mean value, normalized using the variance of amplitudes of the power spectrum modes. The low off-diagonal contributions are a clear indication that our method correctly accounted and corrected for otherwise erroneous mode coupling, typically introduced by survey systematic effects and uncertainties. The expected correlations correspond to the lines of sight grid.
Current usage metrics show cumulative count of Article Views (full-text article views including HTML views, PDF and ePub downloads, according to the available data) and Abstracts Views on Vision4Press platform.
Data correspond to usage on the plateform after 2015. The current usage metrics is available 48-96 hours after online publication and is updated daily on week days.
Initial download of the metrics may take a while.