Free Access
Fig. 9.
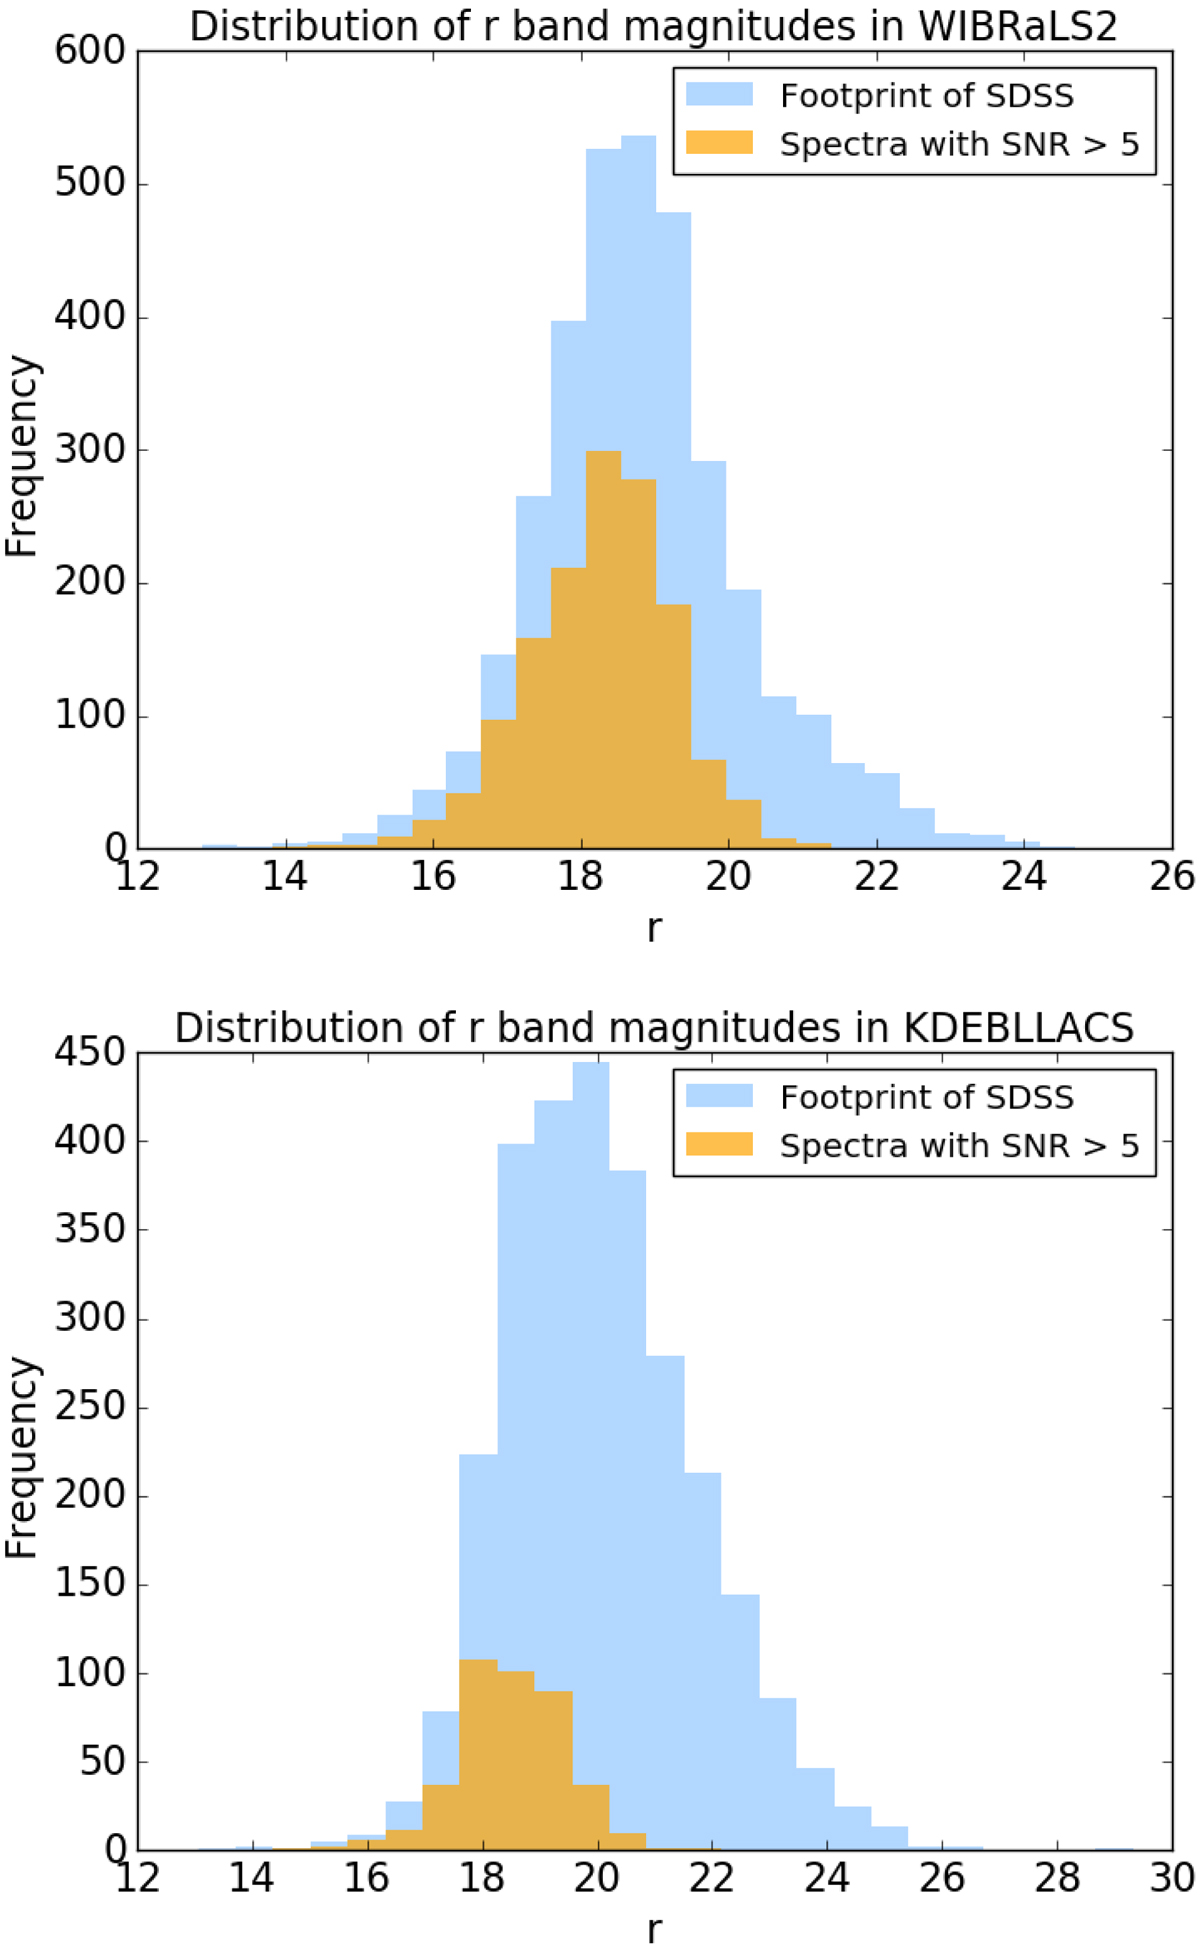
Distribution of r band magnitudes for WIBRaLS2 (upper panel) and KDEBLLACS (bottom panel). The blue histograms represent all WIBRaLS2 and KDEBLLACS sources in the footprint of SDSS (3407 and 2807, respectively), while the orange histograms show only sources with high-quality (S/N > 5) spectra in SDSS DR15.
Current usage metrics show cumulative count of Article Views (full-text article views including HTML views, PDF and ePub downloads, according to the available data) and Abstracts Views on Vision4Press platform.
Data correspond to usage on the plateform after 2015. The current usage metrics is available 48-96 hours after online publication and is updated daily on week days.
Initial download of the metrics may take a while.