Fig. 5.
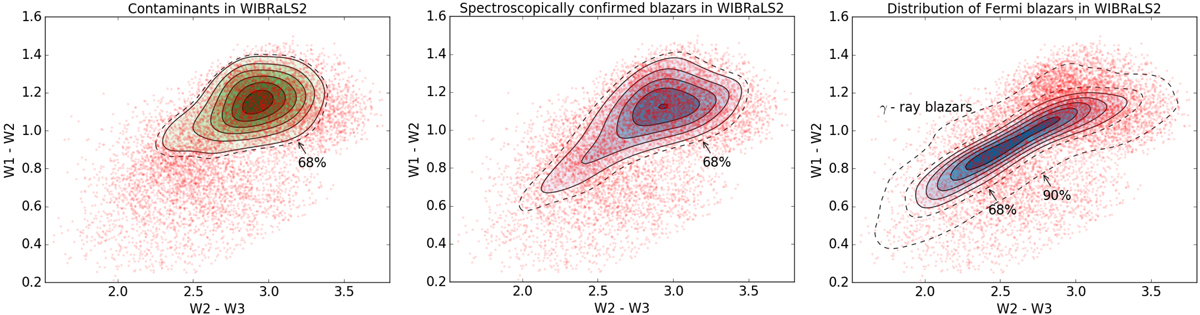
Contaminants in WIBRaLS2. Left: contamination of WIBRaLS2 obtained based on a KDE and using the SDSS DR15 spectra of 953 sources (833 QSOs, 100 Seyferts and 20 LINERs) as a training sample. The contaminants are mainly QSOs concentrated in the WBZQ region of the color–color diagram (as pointed in Fig. 1). Middle: PDF of spectroscopically confirmed blazars in WIBRaLS2 (KDE training set composed of 281 BZQs, 95 BZBs, 36 BZGs and 24 BZUs). Most of them lie in the most contaminated region of WIBRaLS2. Right: PDF of γ-ray blazars obtained using 1320 cross-matches between 4FGL blazars and WIBRaLS2 sources as a training sample for a KDE. The γ-ray blazars are mainly located in a narrow strip peaking in the WBZB region. The solid lines represent the isodensity contours obtained with the KDE, while the dashed lines indicate the 68% and (for the last panel) 90%.
Current usage metrics show cumulative count of Article Views (full-text article views including HTML views, PDF and ePub downloads, according to the available data) and Abstracts Views on Vision4Press platform.
Data correspond to usage on the plateform after 2015. The current usage metrics is available 48-96 hours after online publication and is updated daily on week days.
Initial download of the metrics may take a while.