Fig. 4.
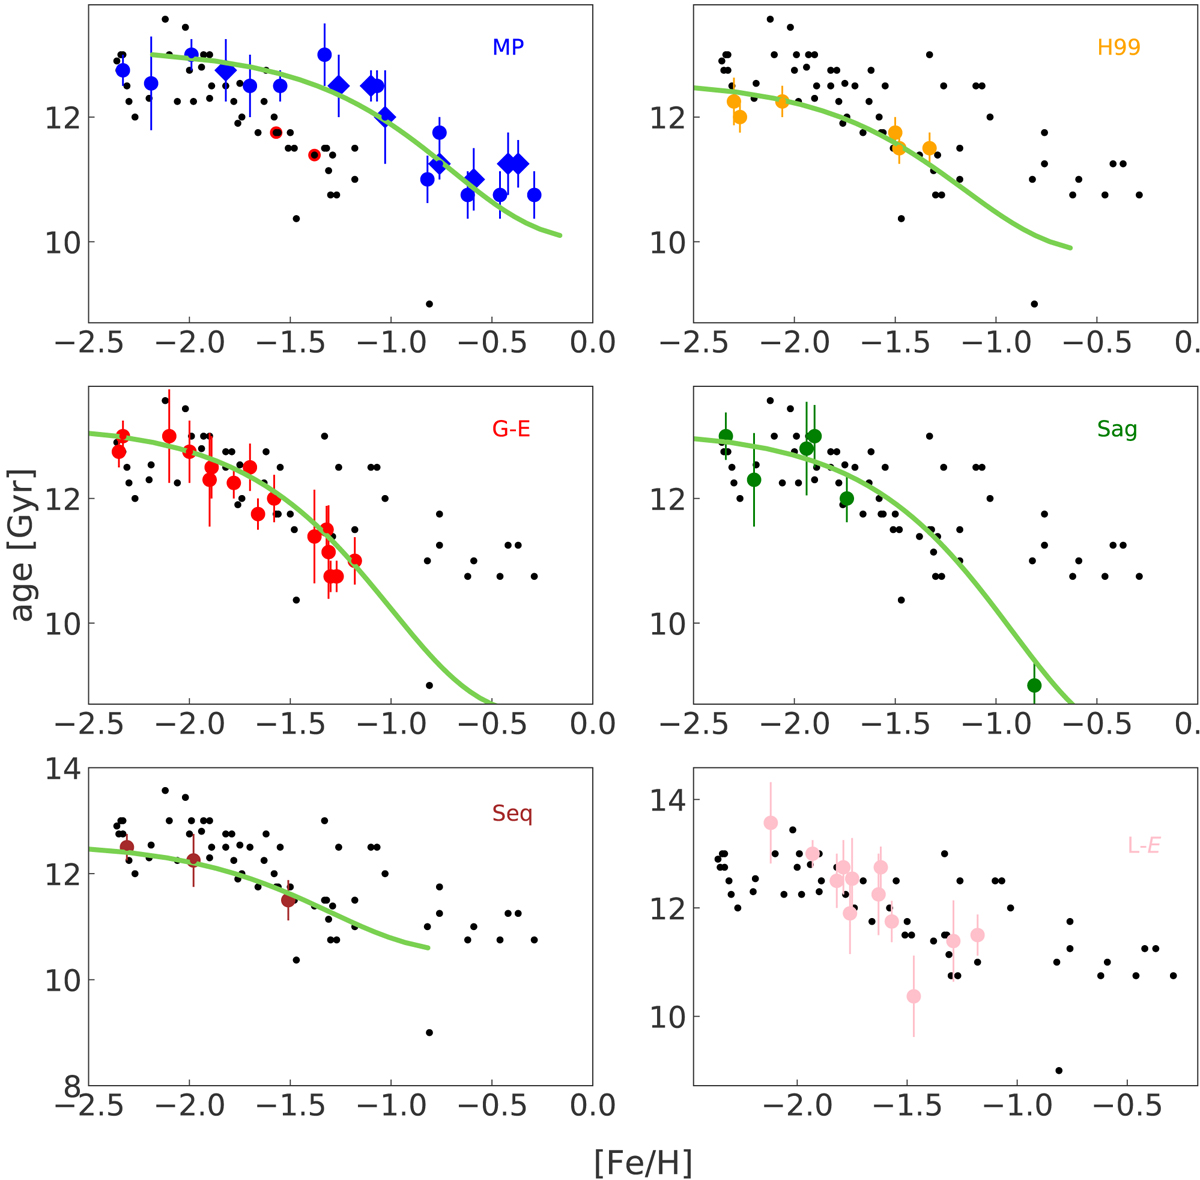
AMRs for the 69 GCs with age estimates, colour-coded as in Fig. 2. The corresponding progenitors are marked in the labels. Individual age uncertainties are also plotted. In the AMR for Main Progenitor clusters (upper-left panel), diamonds represents bulge clusters while circles describe disc clusters. The two red-circled black symbols are the two clusters that satisfy the disc membership criteria but that are excluded because they are near the boundary of the respective IOM region and their location in the AMR.
Current usage metrics show cumulative count of Article Views (full-text article views including HTML views, PDF and ePub downloads, according to the available data) and Abstracts Views on Vision4Press platform.
Data correspond to usage on the plateform after 2015. The current usage metrics is available 48-96 hours after online publication and is updated daily on week days.
Initial download of the metrics may take a while.