Fig. 2.
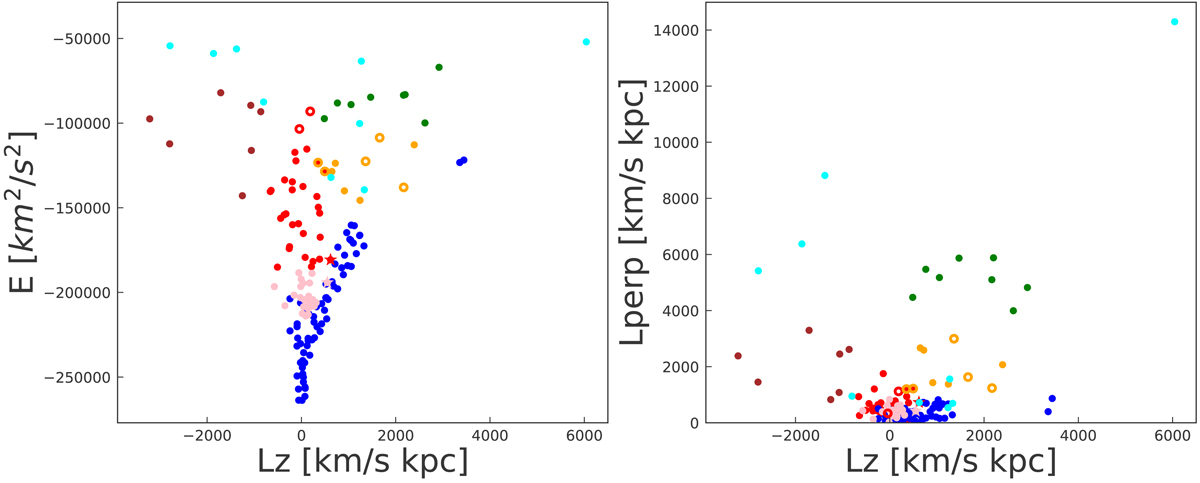
Two projections of IOM space for the 151 GCs in our sample, colour-coded according to their associations with different progenitors (blue symbols mark the Main Progenitor, red is for Gaia-Enceladus, green for Sagittarius, orange for the progenitor of the Helmi streams, brown for Sequoia, pink for the low-energy group, and cyan for the high-energy group). For visualisation purposes, two clusters (Crater and E1) with extremely negative LZ have not been plotted. Empty symbols correspond to tentative associations. The two star symbols mark the young and metal-poor clusters excluded by the Disc selection.
Current usage metrics show cumulative count of Article Views (full-text article views including HTML views, PDF and ePub downloads, according to the available data) and Abstracts Views on Vision4Press platform.
Data correspond to usage on the plateform after 2015. The current usage metrics is available 48-96 hours after online publication and is updated daily on week days.
Initial download of the metrics may take a while.