Fig. 9.
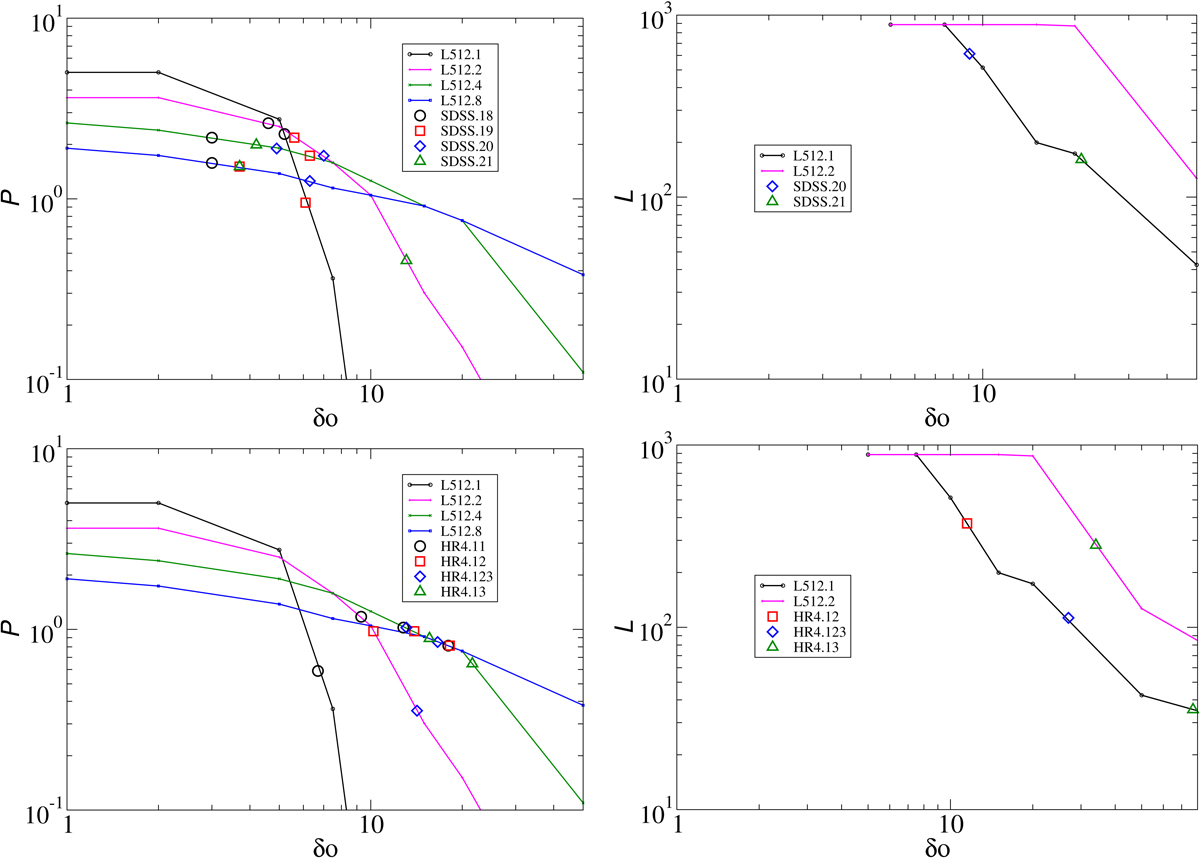
Left panels: cluster percolation threshold test, right panels: cluster length test for high-luminosity (mass) samples. Upper panels are for SDSS samples, lower panels for HR4 samples. Solid lines show cluster length test functions of L512 models for various smoothing scales. Coloured symbols show SDSS samples of various luminosity and HR4 samples of various halo mass limits.
Current usage metrics show cumulative count of Article Views (full-text article views including HTML views, PDF and ePub downloads, according to the available data) and Abstracts Views on Vision4Press platform.
Data correspond to usage on the plateform after 2015. The current usage metrics is available 48-96 hours after online publication and is updated daily on week days.
Initial download of the metrics may take a while.