Fig. 5.
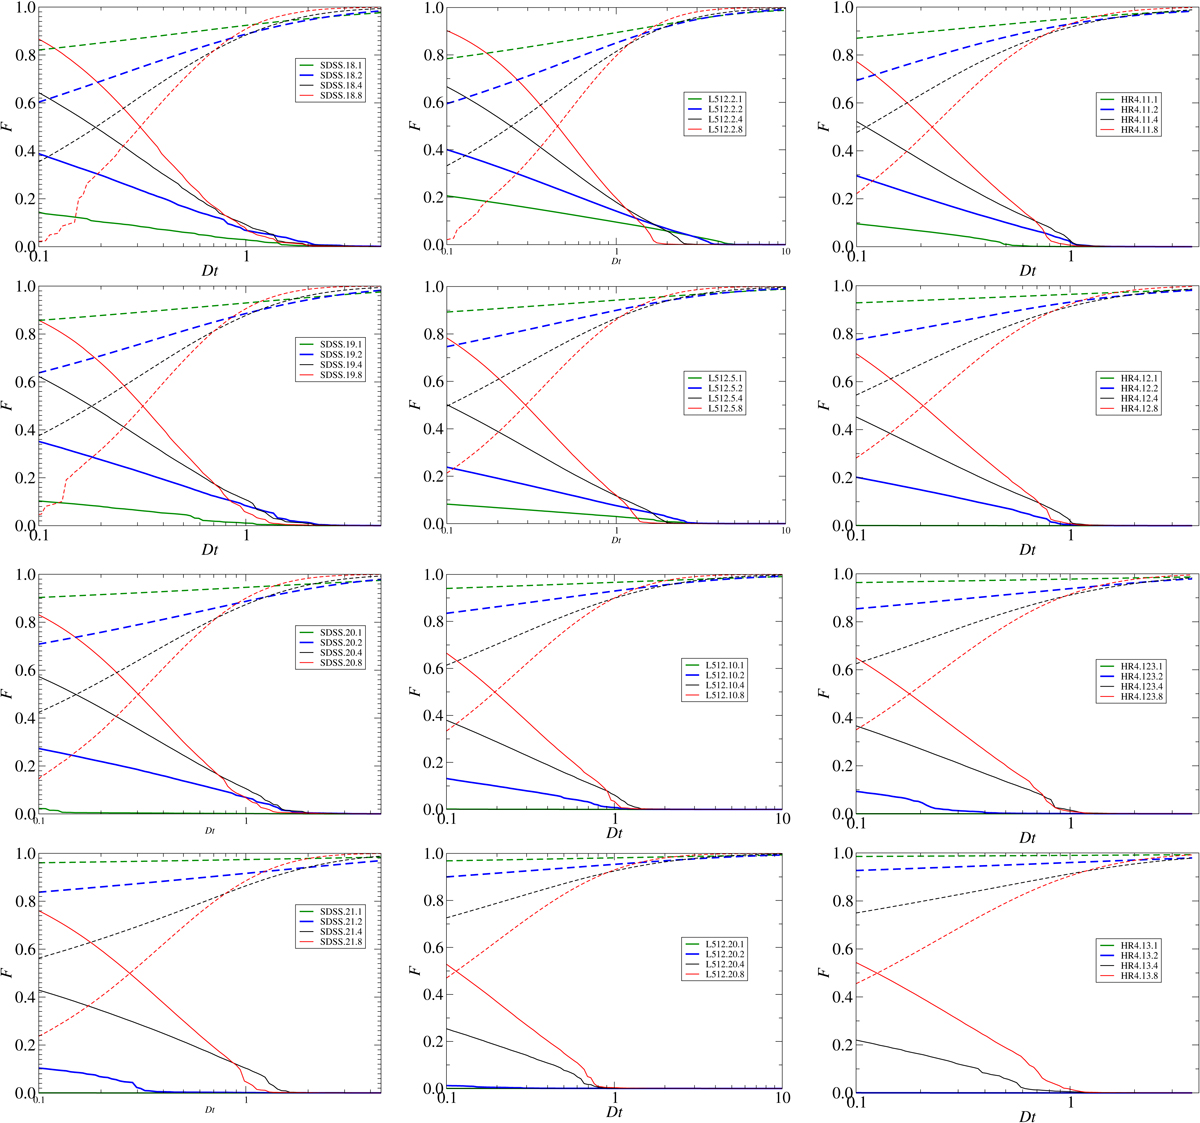
Filling-factor functions of largest clusters and voids, ℱ(Dt) = Vmax/V0, as functions of the threshold density, Dt. Left panels: luminosity-limited SDSS samples. Middle panels: particle-density limited (biased) L512 model samples. Right panels: HR4 model samples. Left panels from top to bottom are for luminosity limits of Mr − 5logh = −18.0, − 19.0, − 20, 0, − 21.0; middle panels from top to bottom are for samples with particle-density limits of δ0 = 2, 5, 10, 20; right panels from top to bottom are for halo- mass-limited samples HR4.11, HR4.12, HR4.123, and HR4.13. Functions for clusters are plotted with solid lines, and those for voids with dashed lines; colours mark different smoothing lengths.
Current usage metrics show cumulative count of Article Views (full-text article views including HTML views, PDF and ePub downloads, according to the available data) and Abstracts Views on Vision4Press platform.
Data correspond to usage on the plateform after 2015. The current usage metrics is available 48-96 hours after online publication and is updated daily on week days.
Initial download of the metrics may take a while.