Fig. 2.
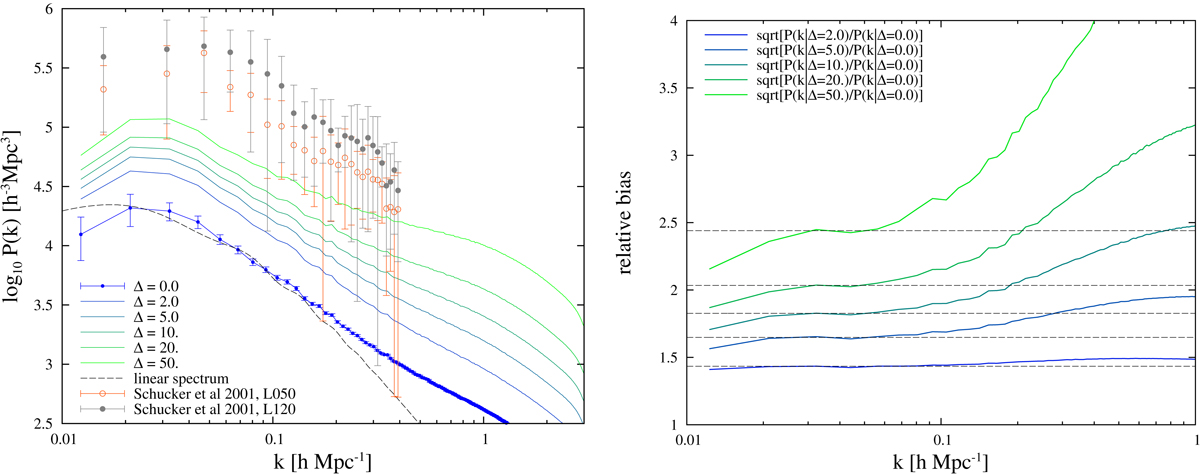
Left: power spectra of particle-density-limited L512 model spectra. The blue solid line with error ticks is for the spectrum of the model with all matter, L512.00 (particle-density limit δ0 = 0). For comparison, dashed black line shows the linear power spectrum. Thin coloured lines are for power spectra, calculated for biased L512.i models according to Table 1. Open and filled symbols with error bars are power spectra of flux-limited X-ray-selected clusters of galaxies, samples L050 and L120, according to Schuecker et al. (2001). Right: relative bias functions for power spectra of density-limited L512 models.
Current usage metrics show cumulative count of Article Views (full-text article views including HTML views, PDF and ePub downloads, according to the available data) and Abstracts Views on Vision4Press platform.
Data correspond to usage on the plateform after 2015. The current usage metrics is available 48-96 hours after online publication and is updated daily on week days.
Initial download of the metrics may take a while.