Fig. 16.
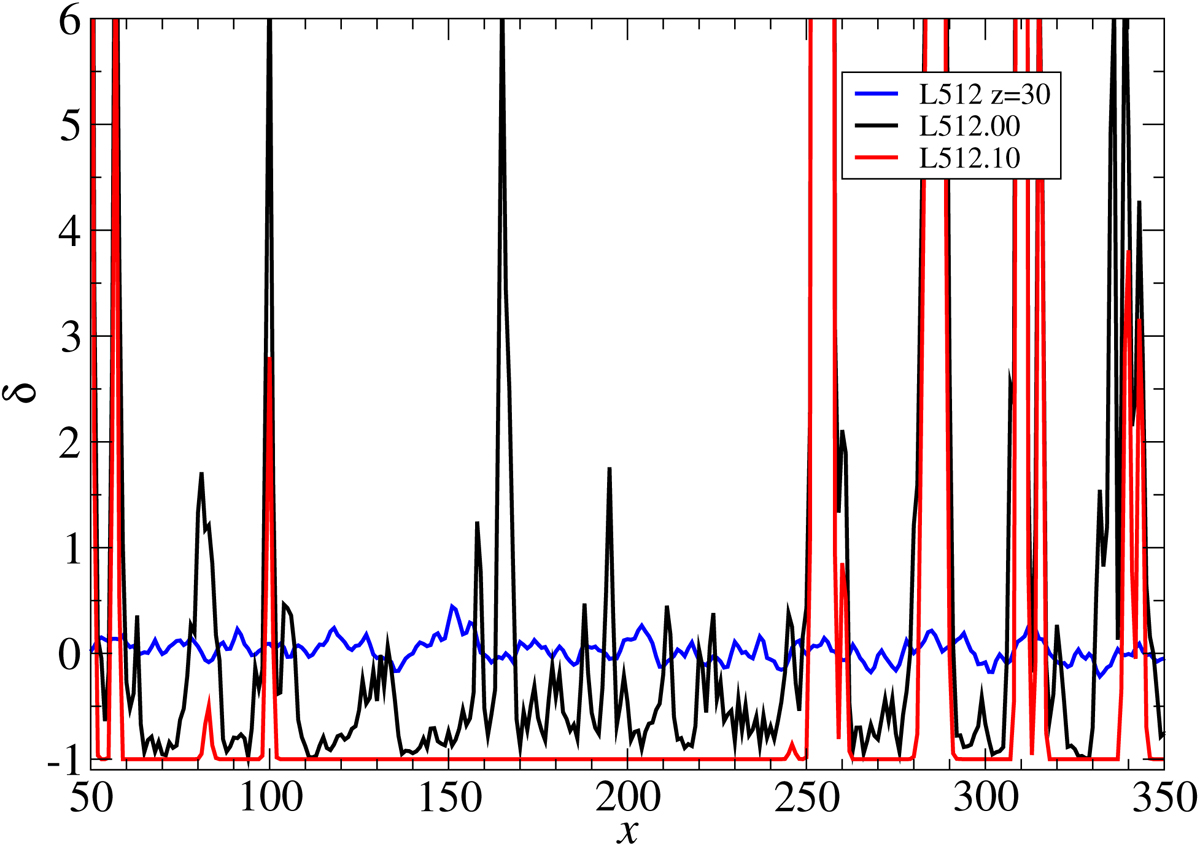
Cross sections of length 300 h−1 Mpc of the density contrast δ(x) = D(x)−1 of the model L512 along the x-spatial coordinate at the same z-coordinate as shown in Fig. 14. The blue line shows the density field of the model L512.00 at a redshift of z = 30. The black line shows the density field of the full model L512.00 at the present epoch, and the red line shows the same but for the biased model L512.10.
Current usage metrics show cumulative count of Article Views (full-text article views including HTML views, PDF and ePub downloads, according to the available data) and Abstracts Views on Vision4Press platform.
Data correspond to usage on the plateform after 2015. The current usage metrics is available 48-96 hours after online publication and is updated daily on week days.
Initial download of the metrics may take a while.