Fig. 15.
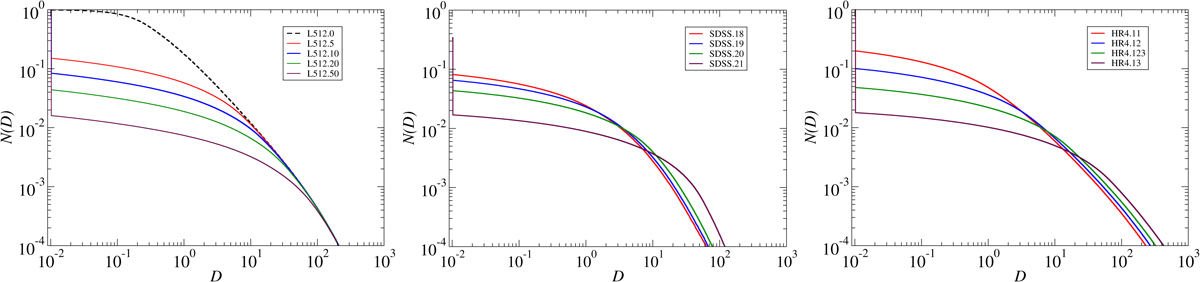
Cumulative distributions of densities of high-resolution density fields of L512, SDSS, and HR4 samples (left, middle, and right panels, respectively). For the L512 model, dashed black line shows the distribution for the full sample with all particles, L512.00, and coloured solid lines for biased model samples L512.5, L512.10, L512.20, and L512.50. Similar coloured lines are used for SDSS, and HR4 samples of various magnitude (halo mass) limits.
Current usage metrics show cumulative count of Article Views (full-text article views including HTML views, PDF and ePub downloads, according to the available data) and Abstracts Views on Vision4Press platform.
Data correspond to usage on the plateform after 2015. The current usage metrics is available 48-96 hours after online publication and is updated daily on week days.
Initial download of the metrics may take a while.