Fig. 1.
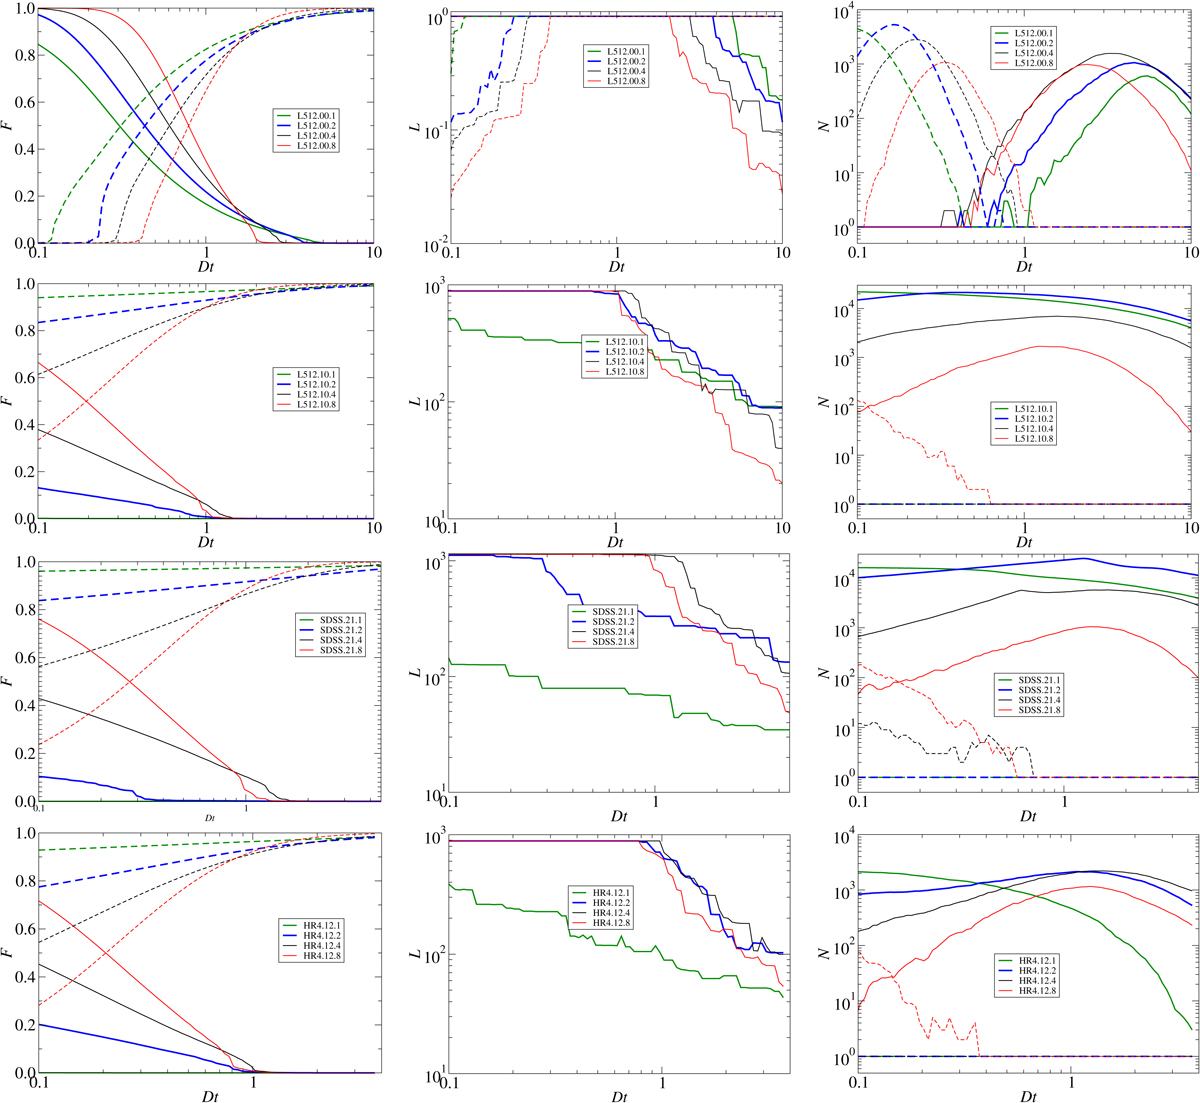
Percolation functions for unbiased L512.00 samples, biased L512.10 samples, and SDSS.21 and HR4.12 samples, from top to bottom panels, respectively. Left panels are for filling factor functions, middle panels for cluster length functions, right panels for number functions. Number functions are calculated with small system exclusion limit Nlim = 50 (L512.10 and SDSS.21 samples); and with Nlim = 500 (L512.00 and HR4.12 samples). Functions for clusters are plotted with solid lines, and for voids with dashed lines.
Current usage metrics show cumulative count of Article Views (full-text article views including HTML views, PDF and ePub downloads, according to the available data) and Abstracts Views on Vision4Press platform.
Data correspond to usage on the plateform after 2015. The current usage metrics is available 48-96 hours after online publication and is updated daily on week days.
Initial download of the metrics may take a while.