Fig. 5.
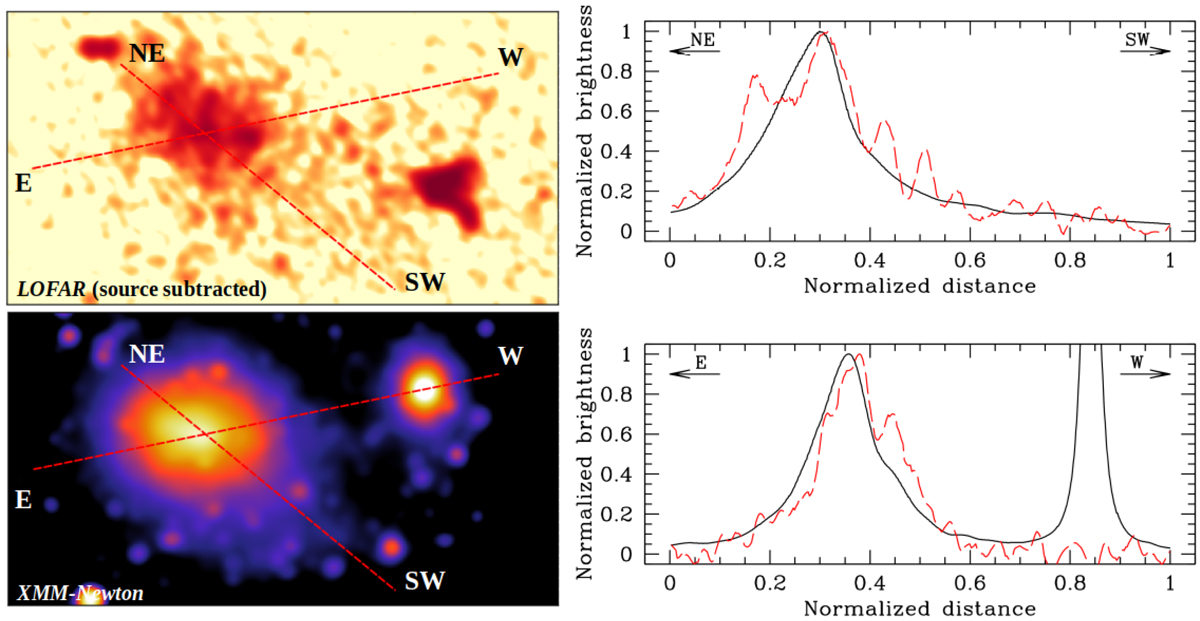
One-dimensional brightness profiles of the X-ray (black lines) and radio emission (red dashed lines) extracted from the dashed lines reported in the left panels that display the LOFAR (discrete source subtracted) and XMM-Newton images convolved with a comparable resolution of 60″. The profiles are normalized at the brightness peak of RXCJ1825 in each band.
Current usage metrics show cumulative count of Article Views (full-text article views including HTML views, PDF and ePub downloads, according to the available data) and Abstracts Views on Vision4Press platform.
Data correspond to usage on the plateform after 2015. The current usage metrics is available 48-96 hours after online publication and is updated daily on week days.
Initial download of the metrics may take a while.