Fig. 4.
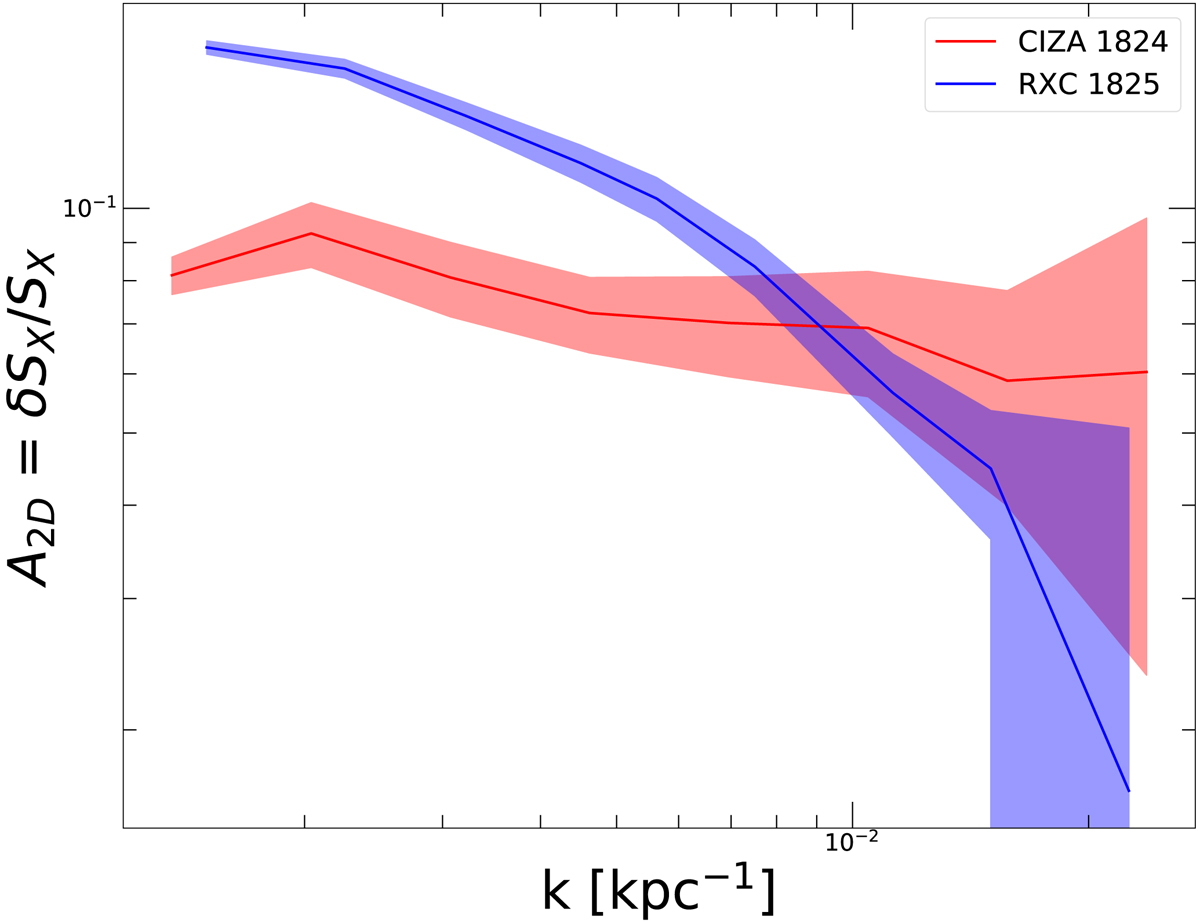
Fractional amplitude of projected (2D) X-ray surface brightness fluctuations A2D = (P2D2πk2)1/2 for RXCJ1825 (blue) and CIZAJ1824 (red) as a function of wave number k. The power spectra P2D were extracted within a circle of 200 kpc radius around the X-ray peak of both structures. The shaded areas show the 1σ confidence intervals for both regions.
Current usage metrics show cumulative count of Article Views (full-text article views including HTML views, PDF and ePub downloads, according to the available data) and Abstracts Views on Vision4Press platform.
Data correspond to usage on the plateform after 2015. The current usage metrics is available 48-96 hours after online publication and is updated daily on week days.
Initial download of the metrics may take a while.