Fig. 2.
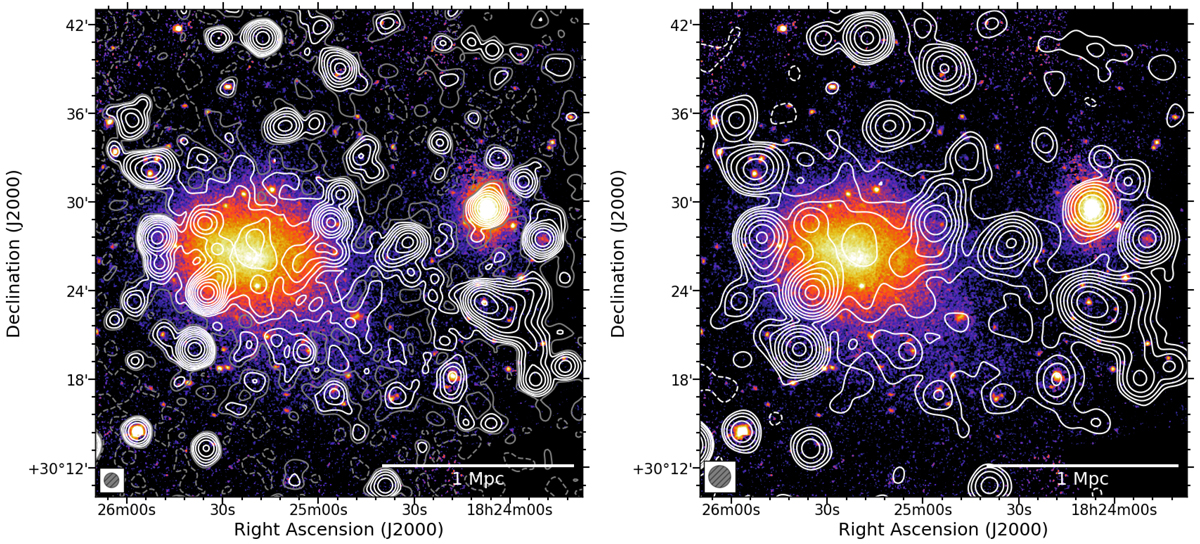
LOFAR radio contours overlaid on the XMM-Newton color image. Left: low-resolution (60″ × 60″) contours spaced by a factor of 2 starting from 1.5σ (the first contour is reported in gray), where σ = 300 μJy beam−1. The negative −1.5σ contours are shown as dashed gray lines. Right: very low-resolution (90″ × 90″) contours spaced by a factor of 2 starting from 3σ, where σ = 415 μJy beam−1. The negative −3σ contours are shown as dashed lines. The beams are displayed in the bottom left corners.
Current usage metrics show cumulative count of Article Views (full-text article views including HTML views, PDF and ePub downloads, according to the available data) and Abstracts Views on Vision4Press platform.
Data correspond to usage on the plateform after 2015. The current usage metrics is available 48-96 hours after online publication and is updated daily on week days.
Initial download of the metrics may take a while.