Free Access
Fig. 3
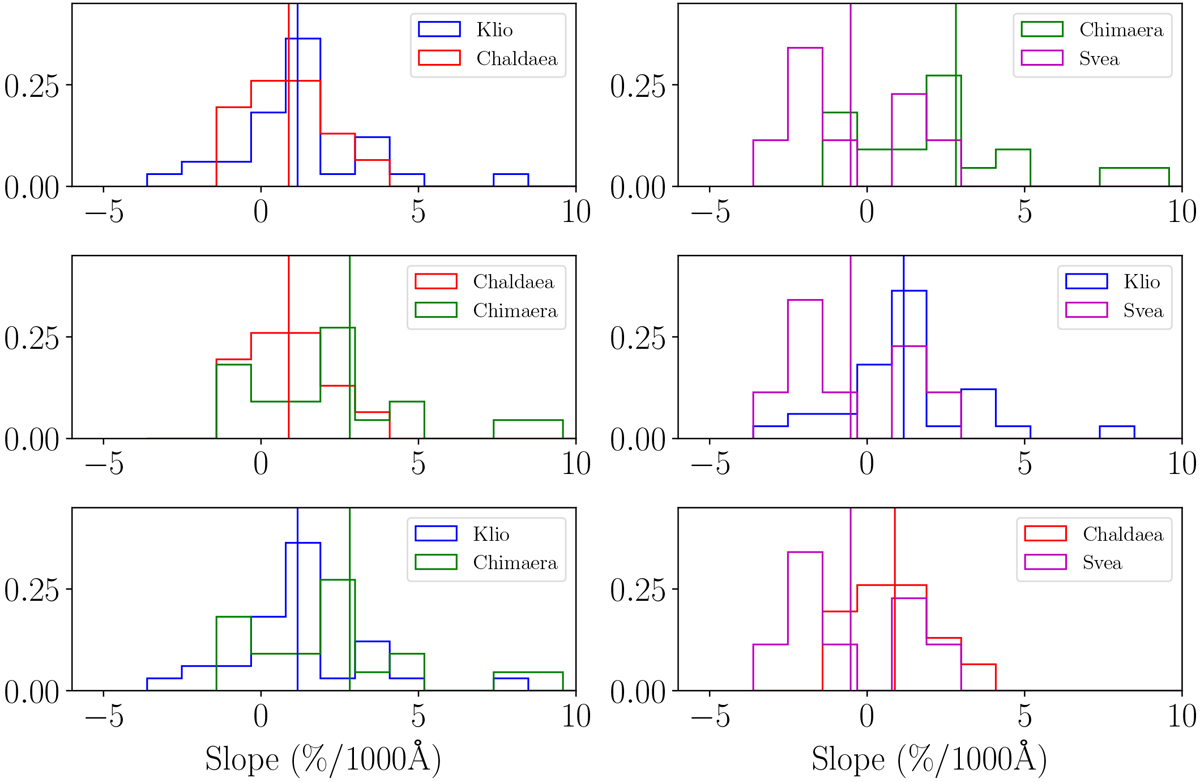
Normalized histograms comparing the spectral slope distributions of the four families studied in the present work. The bin size is 1.1%∕1000 Å. The Klio family is represented in blue, Chaldaea in red, Chimaera in green, and Svea in magenta. The vertical lines represent the mean values of the slope distributions.
Current usage metrics show cumulative count of Article Views (full-text article views including HTML views, PDF and ePub downloads, according to the available data) and Abstracts Views on Vision4Press platform.
Data correspond to usage on the plateform after 2015. The current usage metrics is available 48-96 hours after online publication and is updated daily on week days.
Initial download of the metrics may take a while.