Fig. 15.
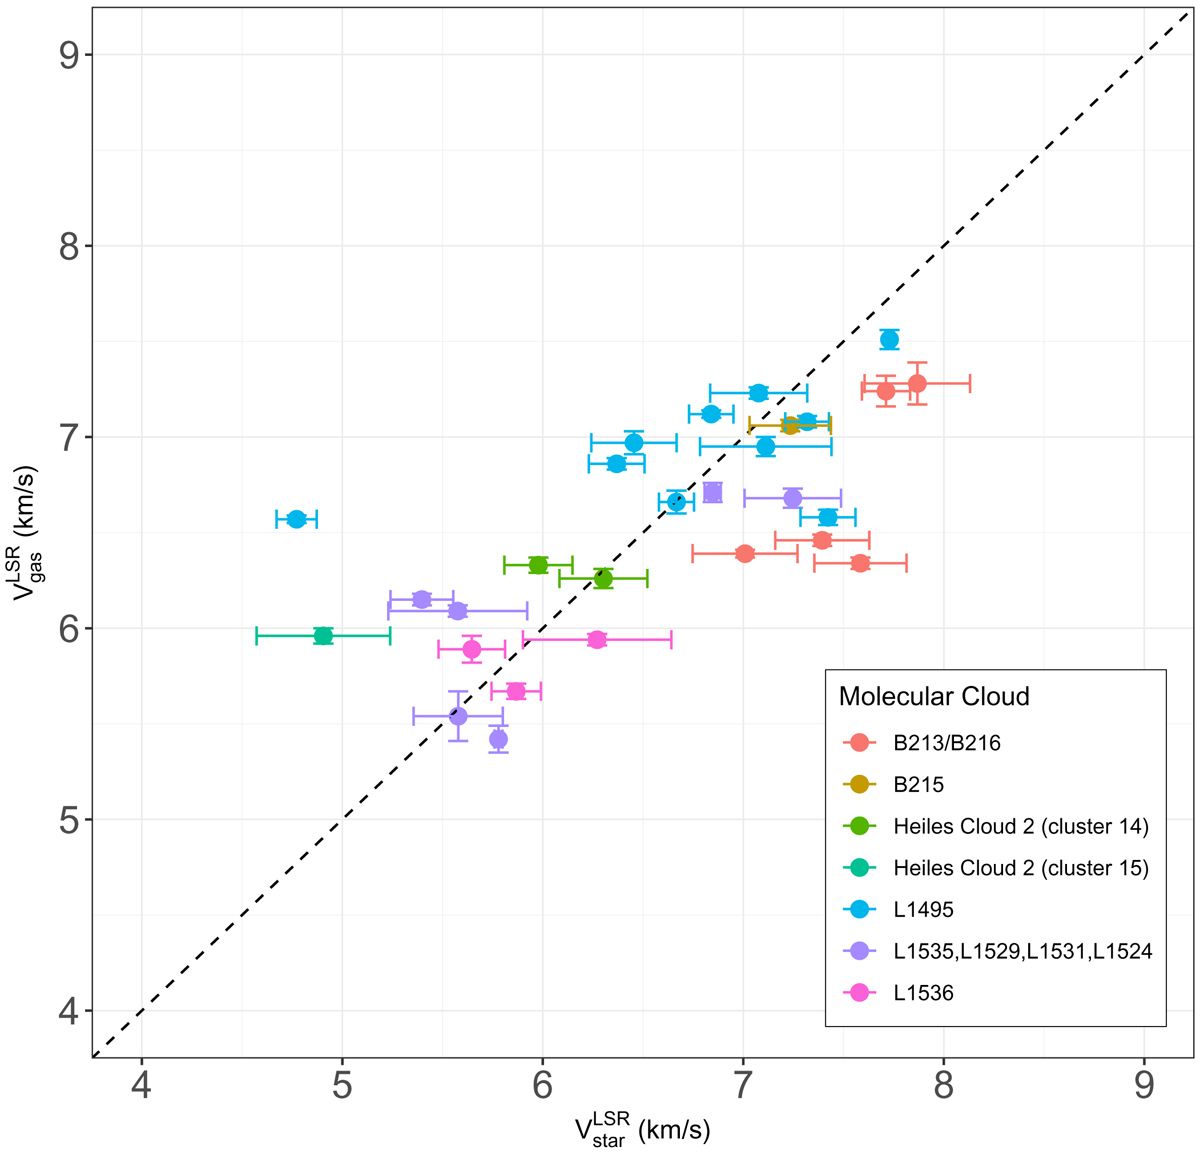
Comparison of the radial velocity of the stars (with respect to the LSR) with the centroid velocity of the 13CO emission extracted from the FCRAO maps at the position of each star. The black dashed line indicates a perfect correlation between the two measurements, and the colors respresent the various molecular clouds to which the stars belong.
Current usage metrics show cumulative count of Article Views (full-text article views including HTML views, PDF and ePub downloads, according to the available data) and Abstracts Views on Vision4Press platform.
Data correspond to usage on the plateform after 2015. The current usage metrics is available 48-96 hours after online publication and is updated daily on week days.
Initial download of the metrics may take a while.