Fig. 10.
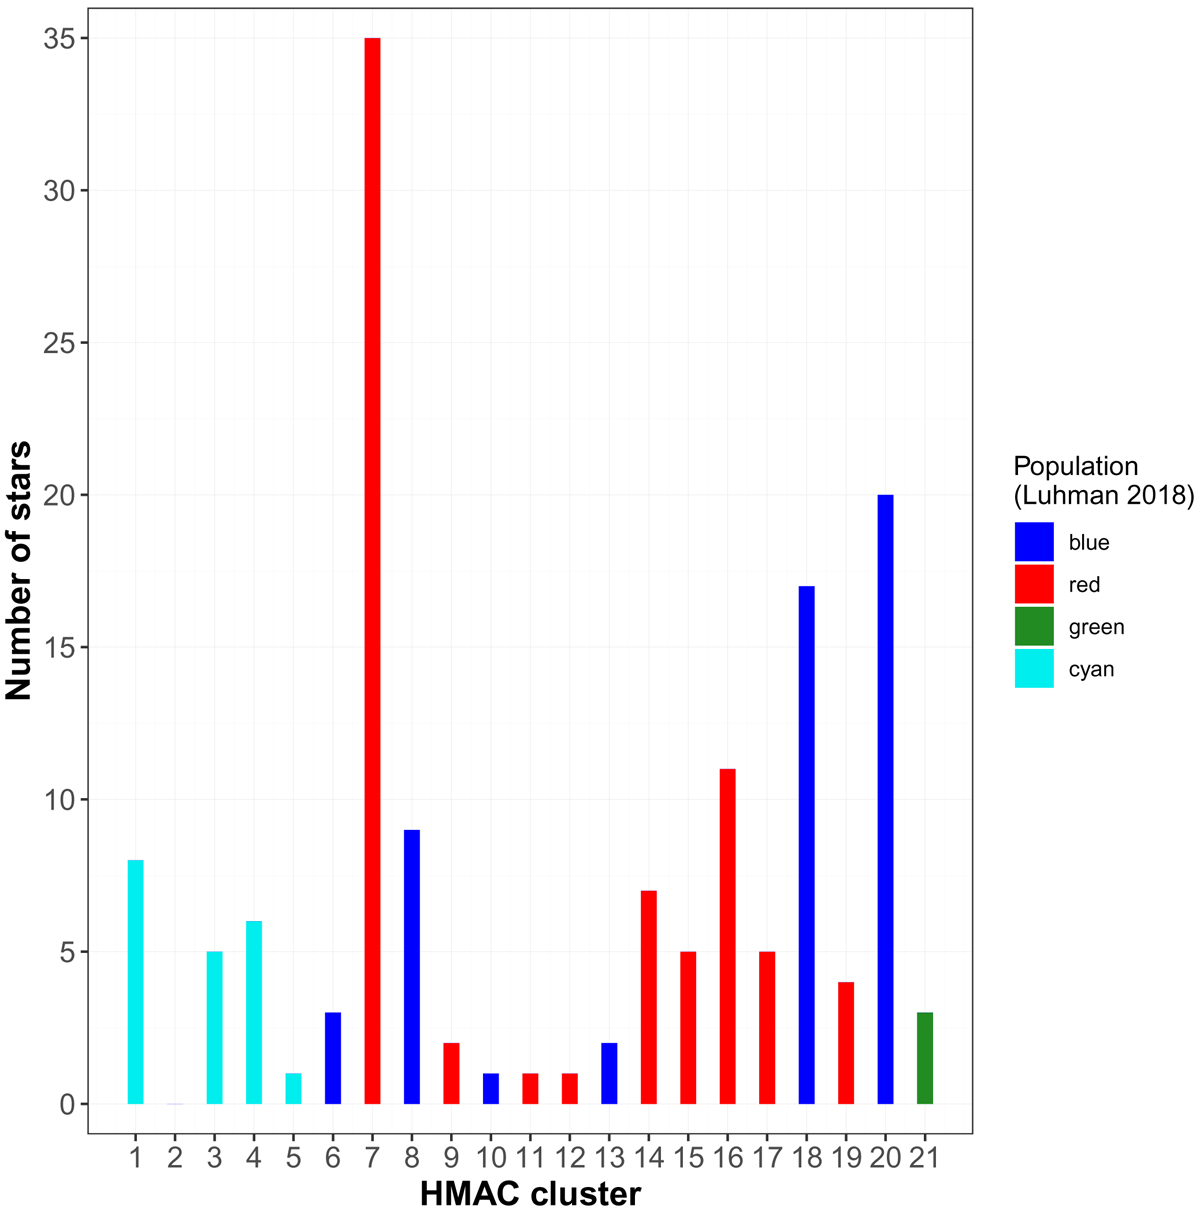
Comparison of the HMAC clustering results obtained in this study with the four populations of Taurus stars (blue, red, green, and cyan) identified by Luhman (2018) from the sample of known Taurus members (Table 1 of that paper). The bar chart indicates the number of stars of each population that are in common with the HMAC clusters.
Current usage metrics show cumulative count of Article Views (full-text article views including HTML views, PDF and ePub downloads, according to the available data) and Abstracts Views on Vision4Press platform.
Data correspond to usage on the plateform after 2015. The current usage metrics is available 48-96 hours after online publication and is updated daily on week days.
Initial download of the metrics may take a while.