Fig. 4.
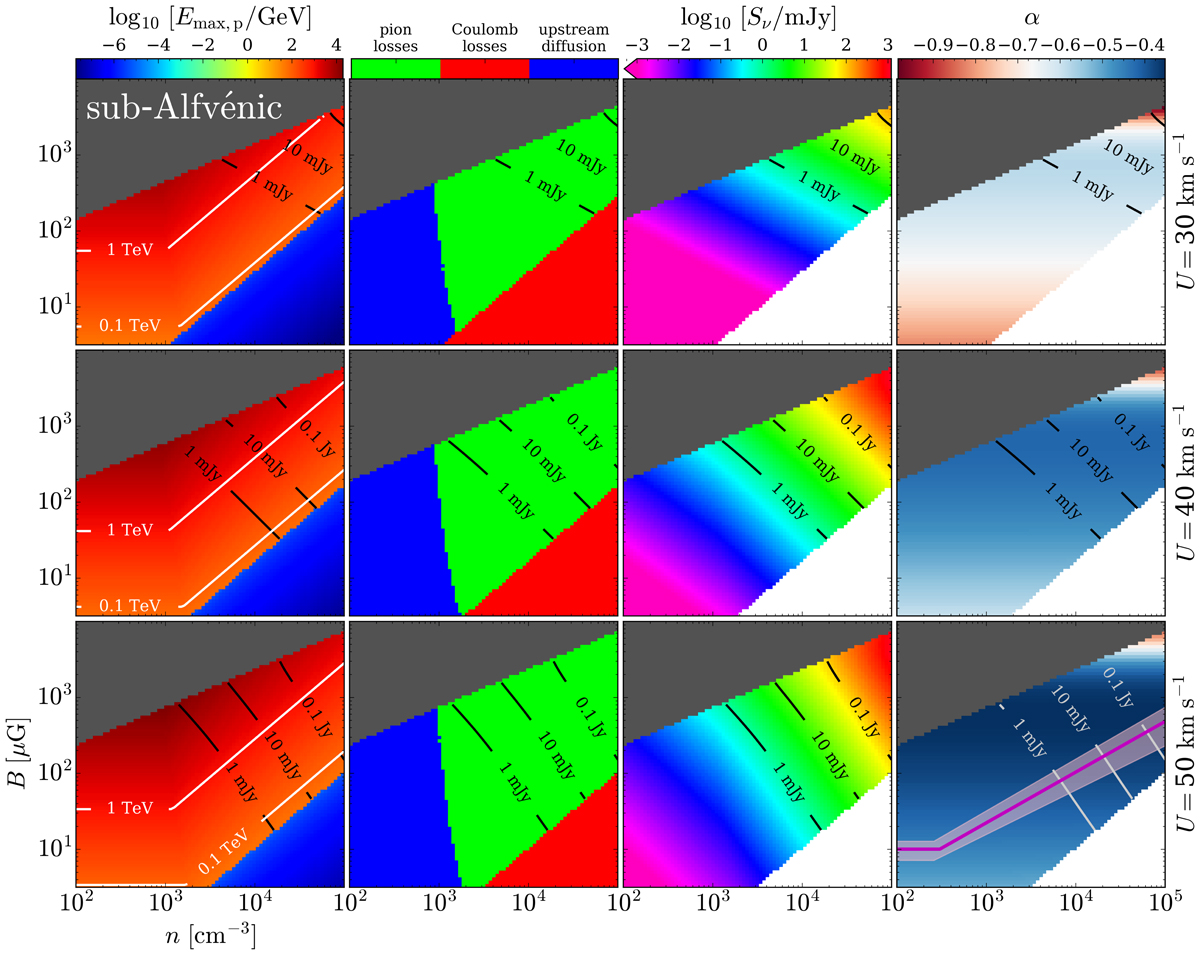
Model results for T = 7500 K, L = 0.5 pc, ν = 300 MHz, and θb = 10″ in parameter space (n, B). Maximum energy of shock-accelerated protons (Emax, p, first column) and its constraining timescales (second column), flux density (Sν, third column), and spectral index (α, fourth column). The three rows show the above quantities at three different flow velocities in the shock reference frame (U = 30, 40, and 50 km s−1). Grey-shaded areas in each subplot show the region of the parameter space where the flow is sub-Alfvénic. Solid white lines in the first column show the iso-contours of Emax, p at 0.1 and 1 TeV. Solid black lines in each subplot (except for the bottom right plot where black has been replaced by light grey) show the iso-flux density between 1 and 100 mJy (from the bottom up). The relation between magnetic field strength and density by Crutcher (2012) together with its uncertainty is shown in the rightmost subplot of the lowest row by a solid red line surrounded by a shaded region.
Current usage metrics show cumulative count of Article Views (full-text article views including HTML views, PDF and ePub downloads, according to the available data) and Abstracts Views on Vision4Press platform.
Data correspond to usage on the plateform after 2015. The current usage metrics is available 48-96 hours after online publication and is updated daily on week days.
Initial download of the metrics may take a while.