Fig. 3.
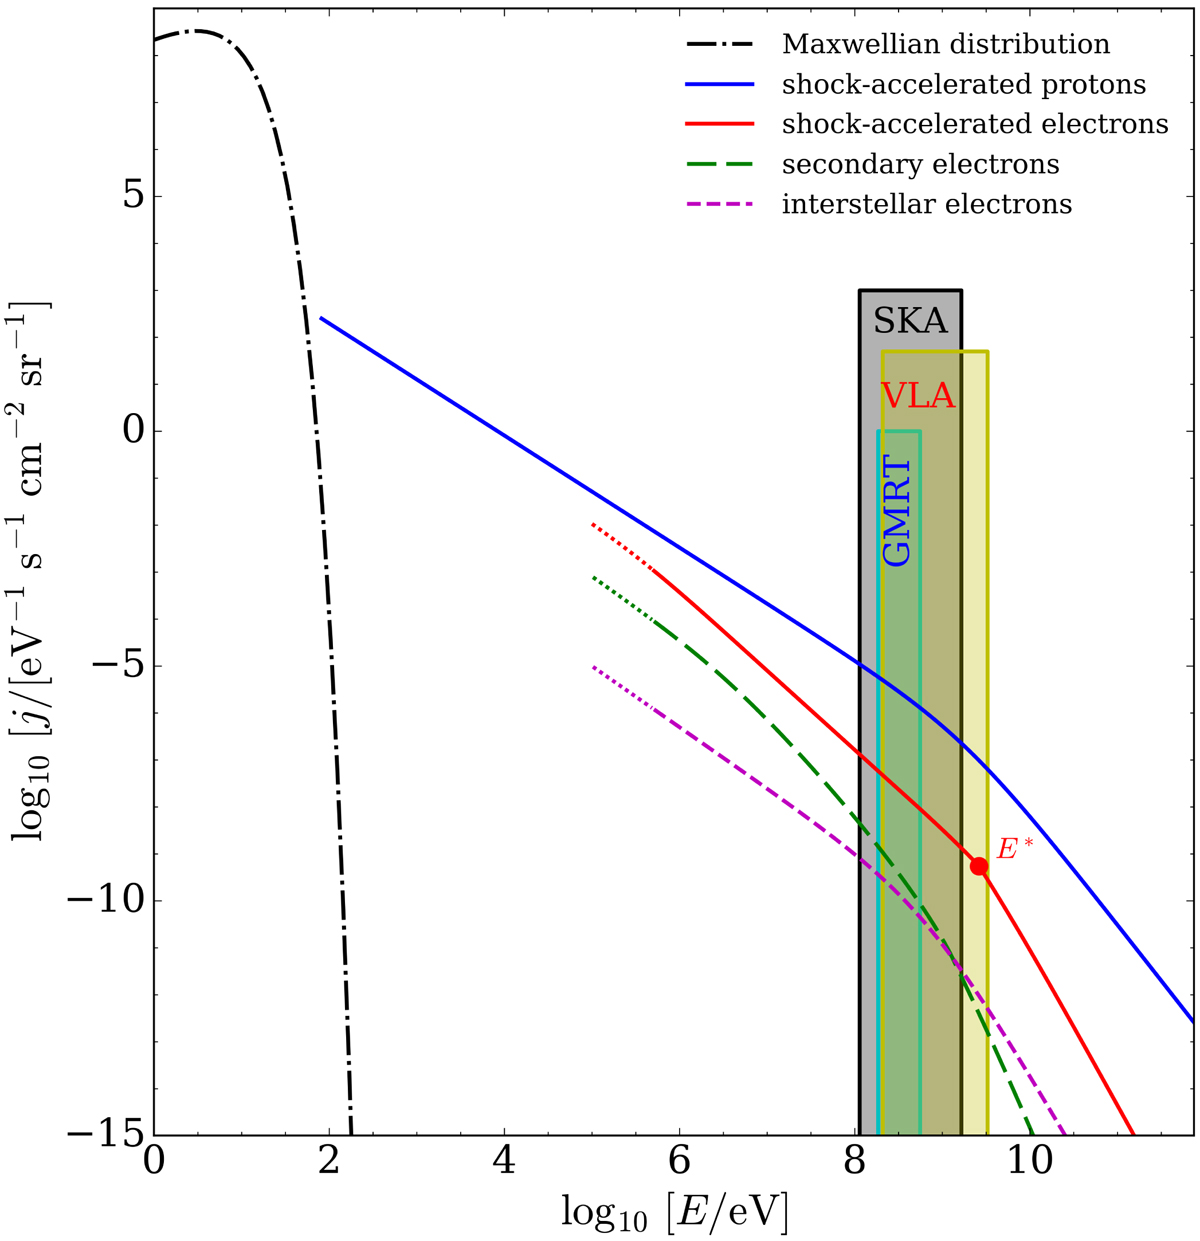
Shock-accelerated fluxes of protons (solid blue line) and electrons (solid red line), secondary electron flux (long-dashed green line), interstellar electron flux (short-dashed magenta line), and Maxwellian distribution of thermal protons (dash-dotted black line) as function of energy. The solid red circle shows the energy E* where synchrotron losses cause a break in the flux slope. The cyan-, black-, and yellow-shaded areas show the electron energy ranges mostly contributing to synchrotron emission for B = 1 mG and frequency ranges of GMRT, SKA, and VLA telescopes, respectively (see Eq. (24)). Dotted lines show the non-relativistic part of the electron fluxes.
Current usage metrics show cumulative count of Article Views (full-text article views including HTML views, PDF and ePub downloads, according to the available data) and Abstracts Views on Vision4Press platform.
Data correspond to usage on the plateform after 2015. The current usage metrics is available 48-96 hours after online publication and is updated daily on week days.
Initial download of the metrics may take a while.