Free Access
Fig. 8.
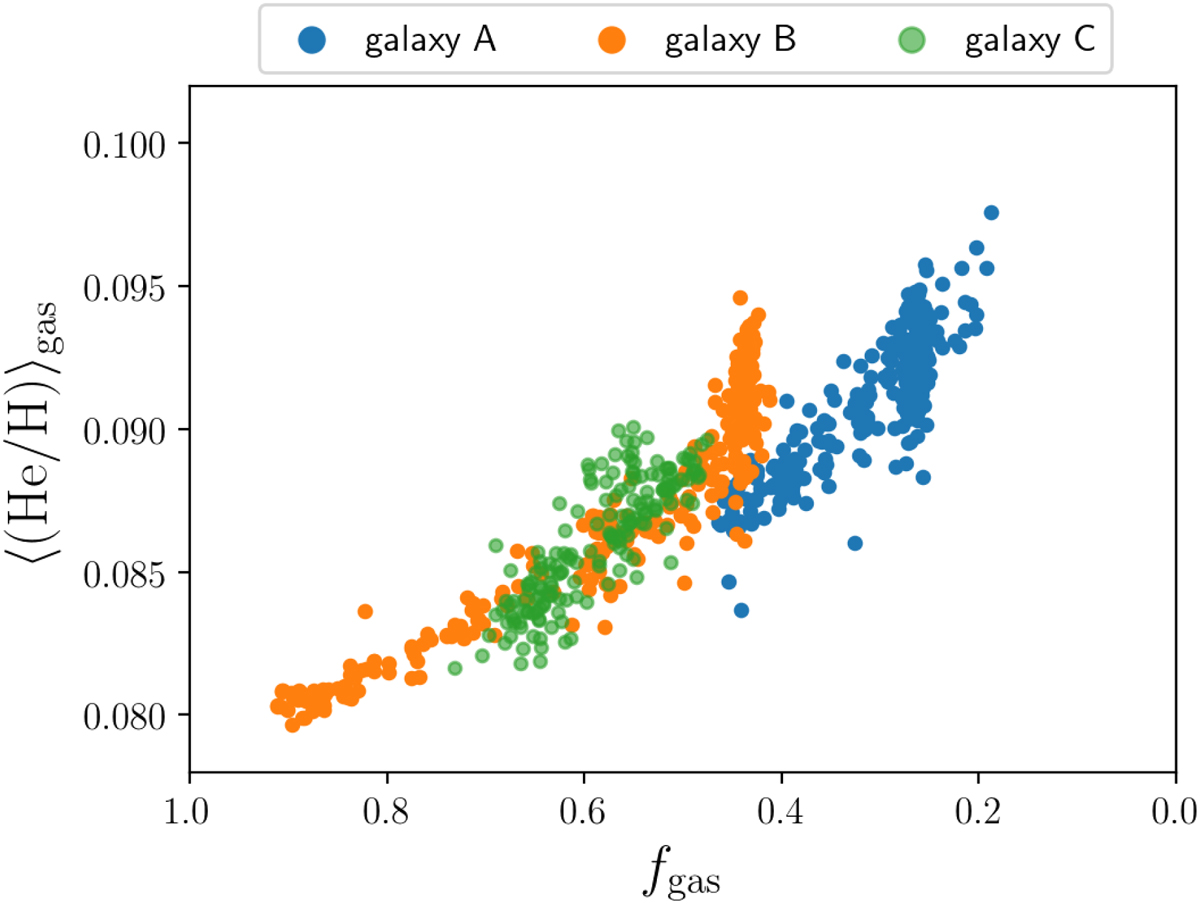
Evolution of the average SFR-weighted He/H abundance as a function of the gas fraction (fgas = Mgas/(Mgas + M⋆)) within our simulated disc galaxies. Blue points correspond to galaxy A, orange points to galaxy B, and green points to galaxy C.
Current usage metrics show cumulative count of Article Views (full-text article views including HTML views, PDF and ePub downloads, according to the available data) and Abstracts Views on Vision4Press platform.
Data correspond to usage on the plateform after 2015. The current usage metrics is available 48-96 hours after online publication and is updated daily on week days.
Initial download of the metrics may take a while.