Fig. 7.
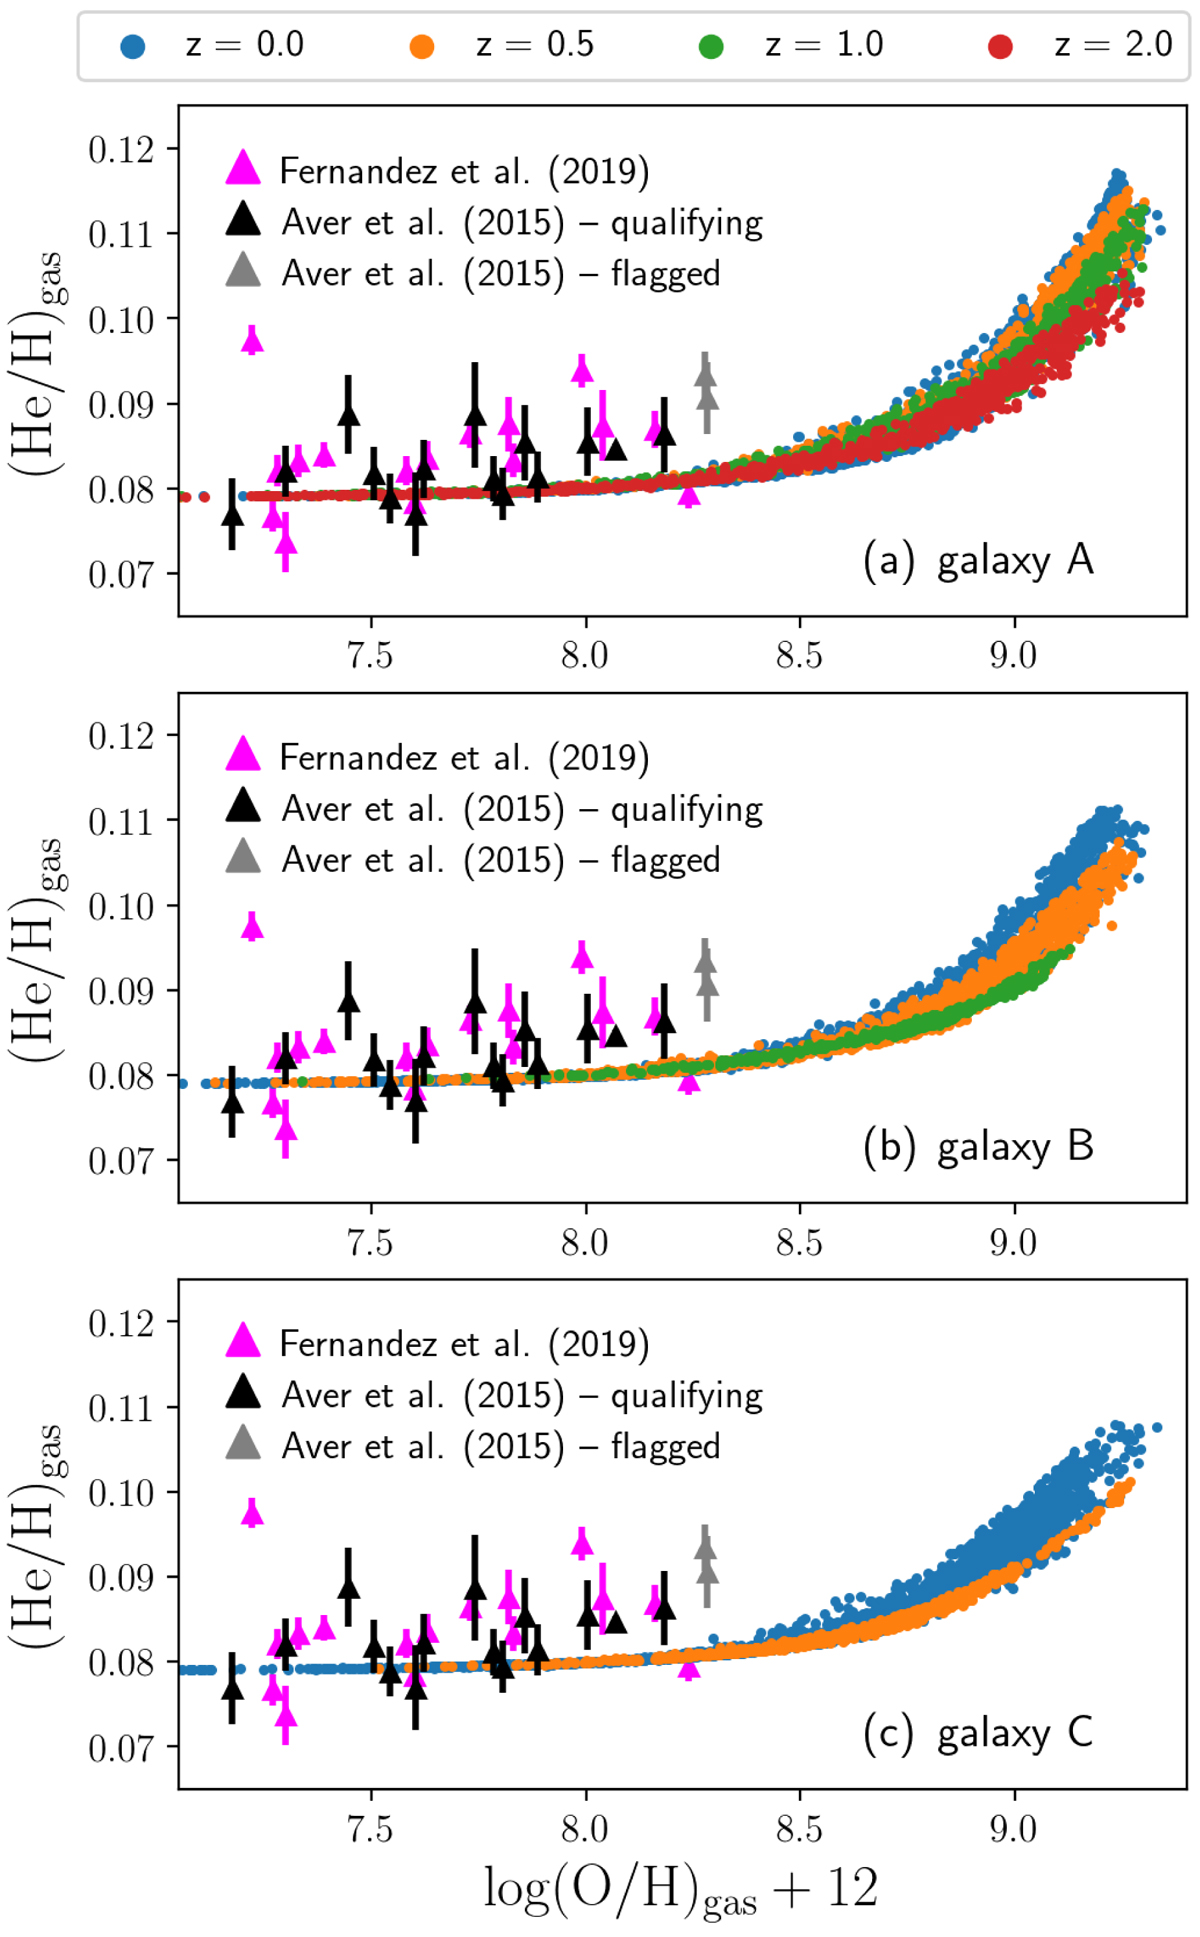
Redshift evolution of the gas-phase He/H−O/H abundance pattern in our three simulated disc galaxies. The blue points correspond to the predicted gas-phase abundances at redshift z = 0, orange points to z = 0.5, green points to z = 1, and red points to z = 2. The black and grey triangles with error bars correspond to the observational data of Aver et al. (2015) for a sample of metal-poor HII regions within 16 emission-line galaxies in the Local Universe; the black triangles correspond to their qualifying sample, whereas the grey triangles mark the abundances affected by large systematic uncertainty. Finally, the magenta points with error bars correspond to the observational data of Fernández et al. (2019).
Current usage metrics show cumulative count of Article Views (full-text article views including HTML views, PDF and ePub downloads, according to the available data) and Abstracts Views on Vision4Press platform.
Data correspond to usage on the plateform after 2015. The current usage metrics is available 48-96 hours after online publication and is updated daily on week days.
Initial download of the metrics may take a while.