Fig. 5.
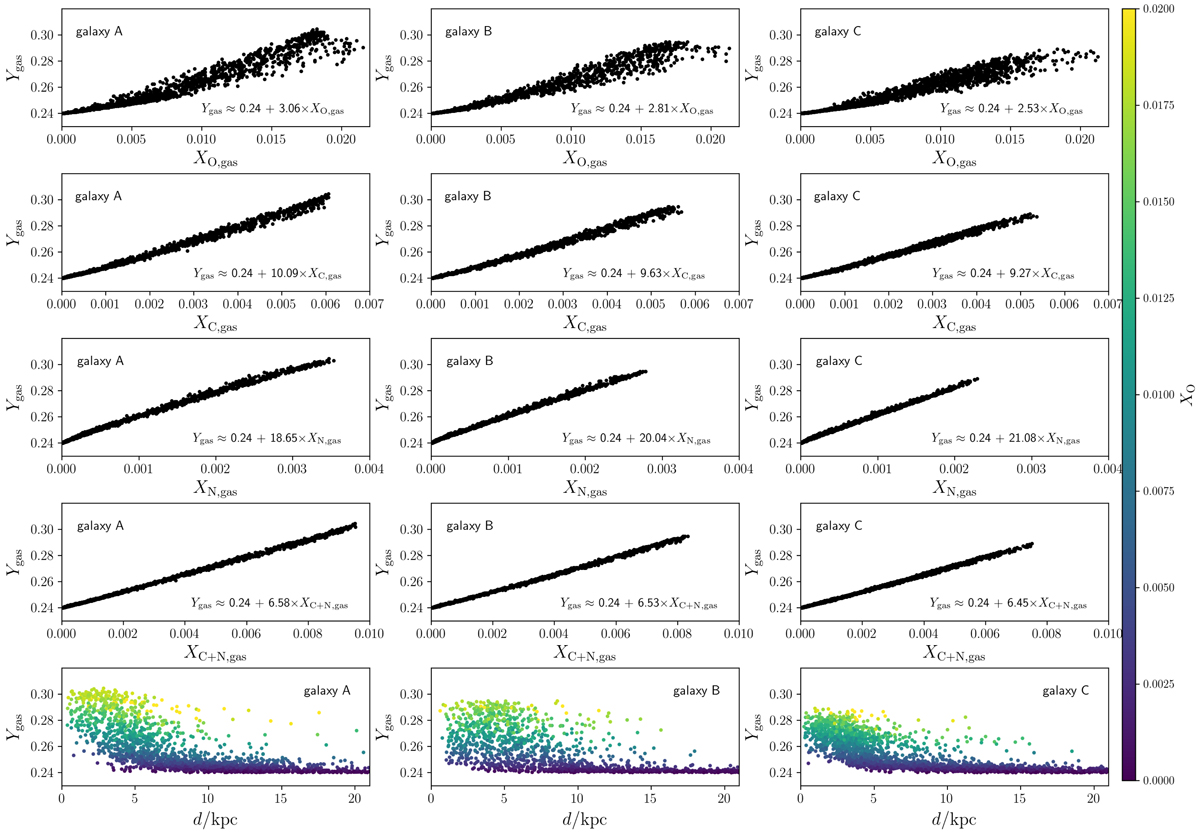
First row (top): gas-phase He mass fraction, Ygas, as a function of the gas-phase O mass fraction, XO,gas. Second row: Ygas vs. XC,gas. Third row: Ygas vs. XN,gas. Fourth row: Ygas vs. XC+N,gas. Fifth row (bottom): predictions for the radial profile of Ygas as a function of the galactocentric distance, d, with the colour coding representing the O mass fraction. From left to right, the various columns correspond to each of our reference galaxies, from galaxy A to galaxy C, respectively.
Current usage metrics show cumulative count of Article Views (full-text article views including HTML views, PDF and ePub downloads, according to the available data) and Abstracts Views on Vision4Press platform.
Data correspond to usage on the plateform after 2015. The current usage metrics is available 48-96 hours after online publication and is updated daily on week days.
Initial download of the metrics may take a while.