Free Access
Fig. 10.
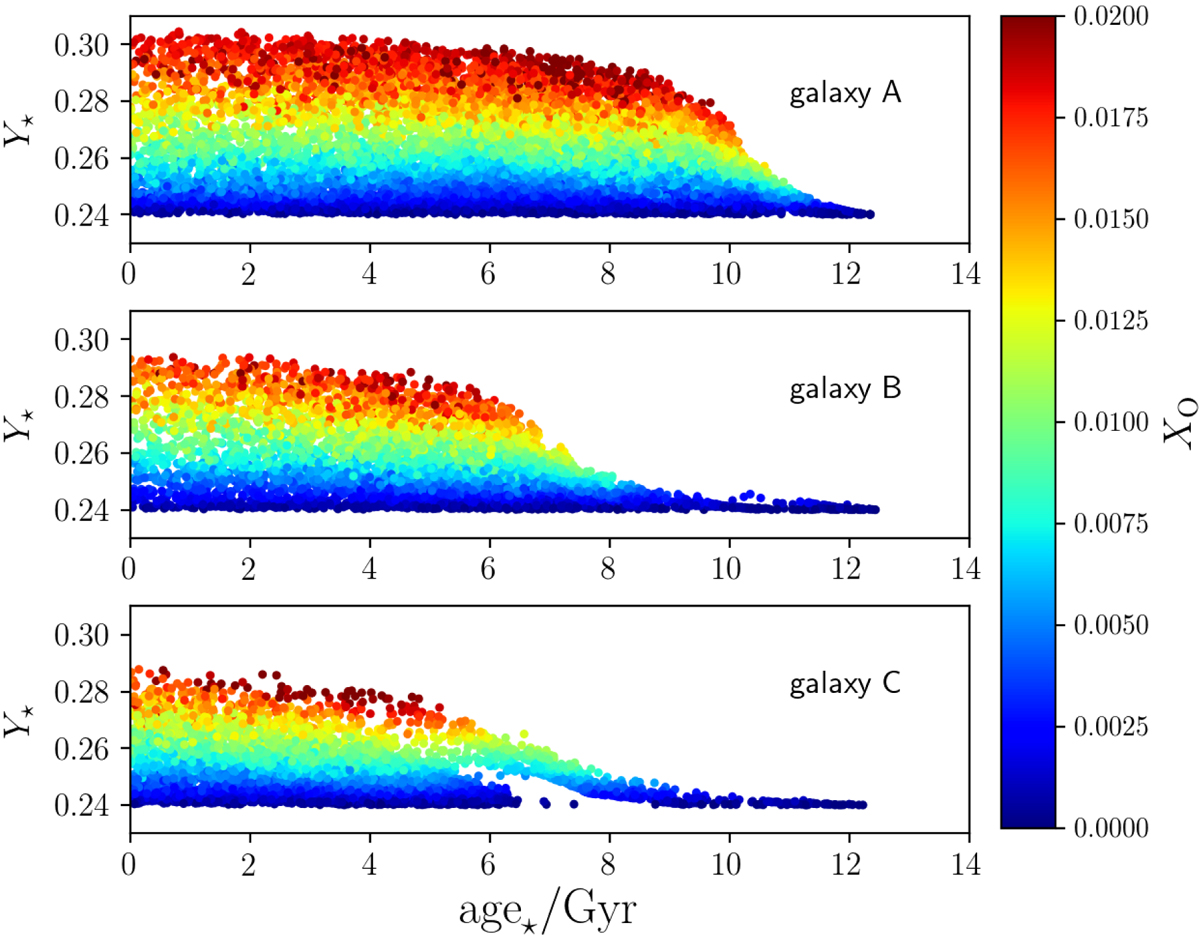
Predicted He mass fraction in the stellar populations of our three reference galaxies as a function of the stellar ages. The colour coding corresponds to the O mass fraction of the stars. Each panel, from top to bottom, shows our predictions for each reference galaxy, from galaxy A to galaxy C, respectively.
Current usage metrics show cumulative count of Article Views (full-text article views including HTML views, PDF and ePub downloads, according to the available data) and Abstracts Views on Vision4Press platform.
Data correspond to usage on the plateform after 2015. The current usage metrics is available 48-96 hours after online publication and is updated daily on week days.
Initial download of the metrics may take a while.