Fig. 2
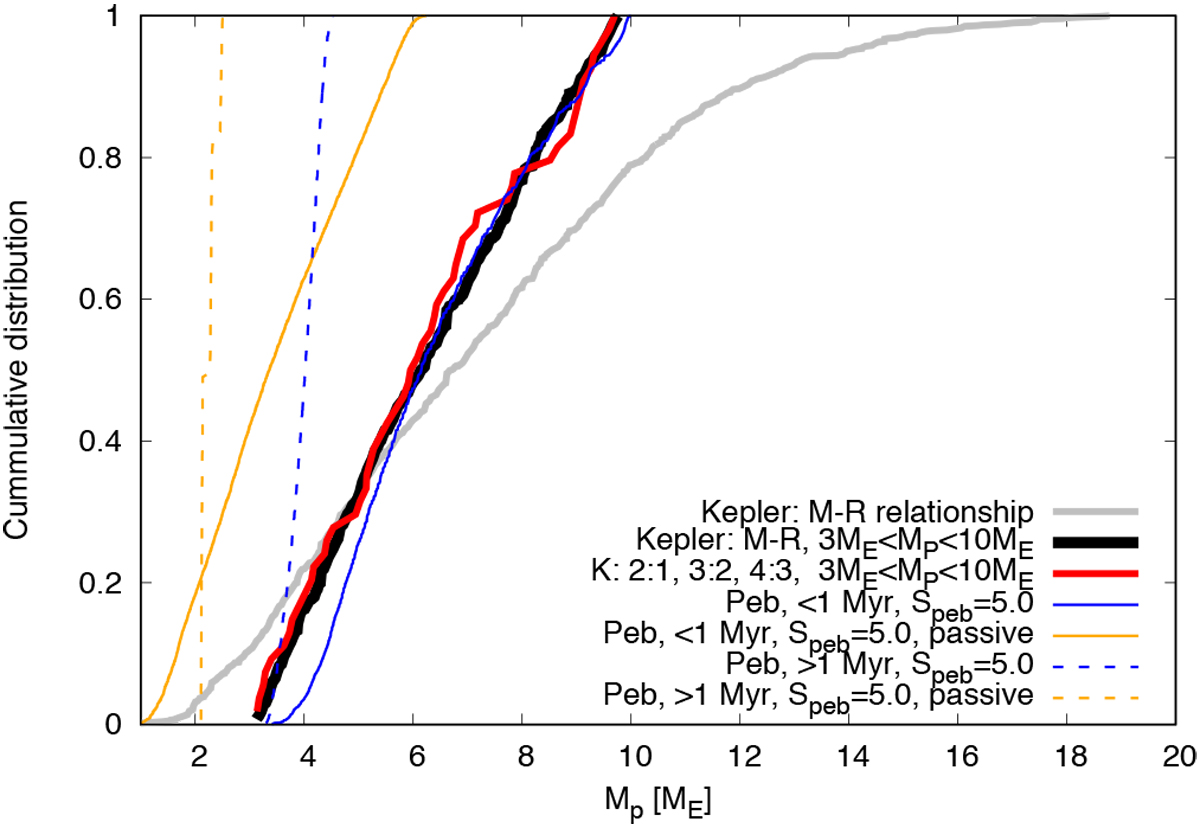
Planetary masses for Kepler systems derived from the mass-radius relationship from Wolfgang et al. (2016), where the grey color shows the same sample as in Fig. 1. In black the Kepler systems with planetary masses ranging from 3 to 10 ME are displayed. In red the masses from systems in period ratios close to ~2:1, 3:2, and 4:3 in the same mass range are shown. The masses of the planets from the simulations, divided into planets that reach the pebble isolation mass before (solid lines) or after 1 Myr (dashed lines) are also shown. The planets growing in the passive disc model do not reach masses conform with the Kepler sample, because the pebble isolation mass is too low in the inner disc, implying that mergers between the planets have to play a key role in this case.
Current usage metrics show cumulative count of Article Views (full-text article views including HTML views, PDF and ePub downloads, according to the available data) and Abstracts Views on Vision4Press platform.
Data correspond to usage on the plateform after 2015. The current usage metrics is available 48-96 hours after online publication and is updated daily on week days.
Initial download of the metrics may take a while.