Fig. 1
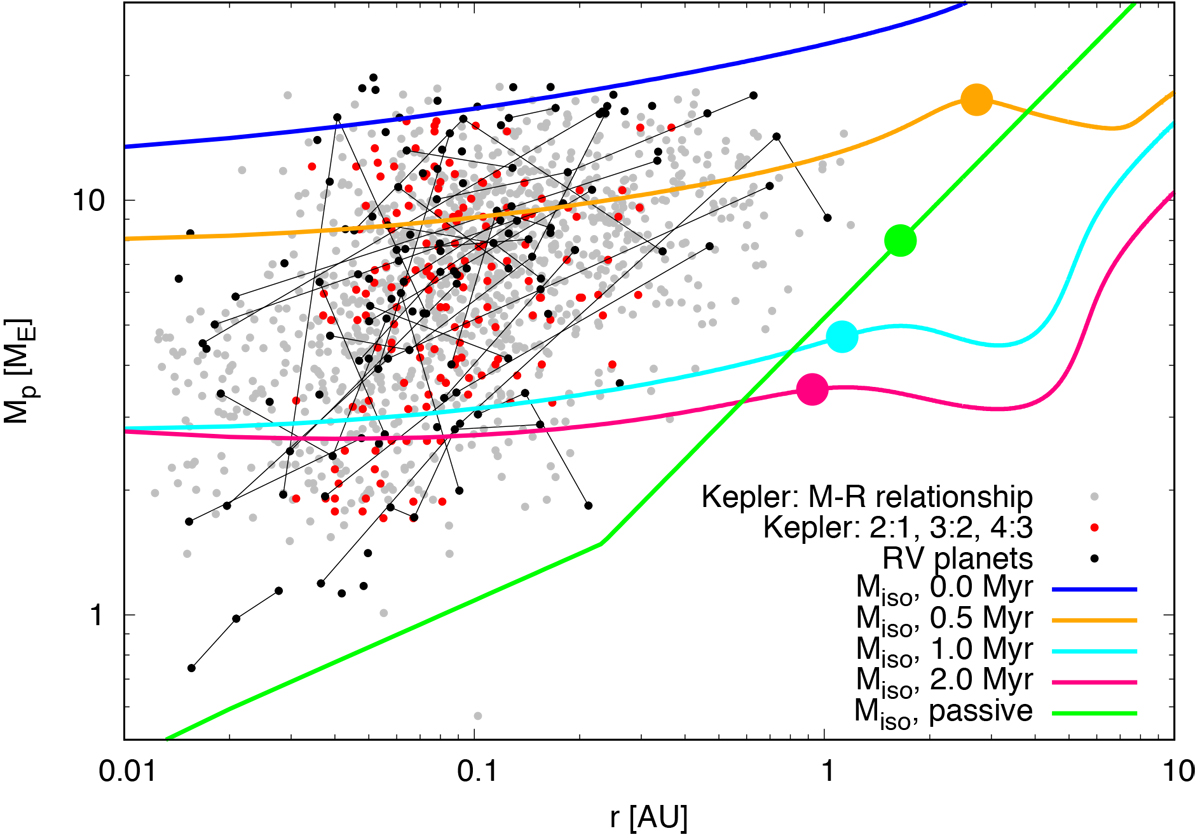
Planetary masses of Kepler systems derived from the mass-radius relationship from Wolfgang et al. (2016), with cut-off at planetary radii of 4 RE (grey dots) and super-Earths detected by RV (black dots) with cut-off at 20 Earth masses. The black lines connect planets within the planetary system (for RV systems only). The red dots correspond to Kepler planets in multiple systems with period ratios of ~2:1, 3:2 and 4:3 to their neighbouring planets. Only planets orbiting around solar mass stars (0.8–1.2 M⊙) are shown. The colour lines correspond to the pebble isolation mass (Miso) from Bitsch et al. (2018a) with aspect ratios derived from 2D disc evolution models including viscous and stellar heating of Bitsch et al. (2015a) as well as a passive disc (green). Just for plotting purposes a Stokes number of 0.1 is used, but the Stokes number of the pebbles varies within the simulations from 0.05 to 0.2. The coloured dots on the lines correspond to the position of the water ice line in these disc models. The disc evolution model implies that if planets from in the inner disc regions that their formation has to be completed within 1 Myr after the disc formation, because otherwise the pebble isolation mass becomes too small to explain the masses of the observed exoplanets. If planets form further out and migrate inwards, the formation time can be much later than 1 Myr, however these planets would form in the cold regions of the protoplanetary disc and would be predominantly of icy composition in contrast to observations that predict that close-in super-Earths should be predominantly rocky (Owen & Wu 2013, 2017; Jin & Mordasini 2018). Late planet formation or planet formation in the passive disc implies that collisions between the bodies are needed to explain the observations.
Current usage metrics show cumulative count of Article Views (full-text article views including HTML views, PDF and ePub downloads, according to the available data) and Abstracts Views on Vision4Press platform.
Data correspond to usage on the plateform after 2015. The current usage metrics is available 48-96 hours after online publication and is updated daily on week days.
Initial download of the metrics may take a while.