Free Access
Fig. 4.
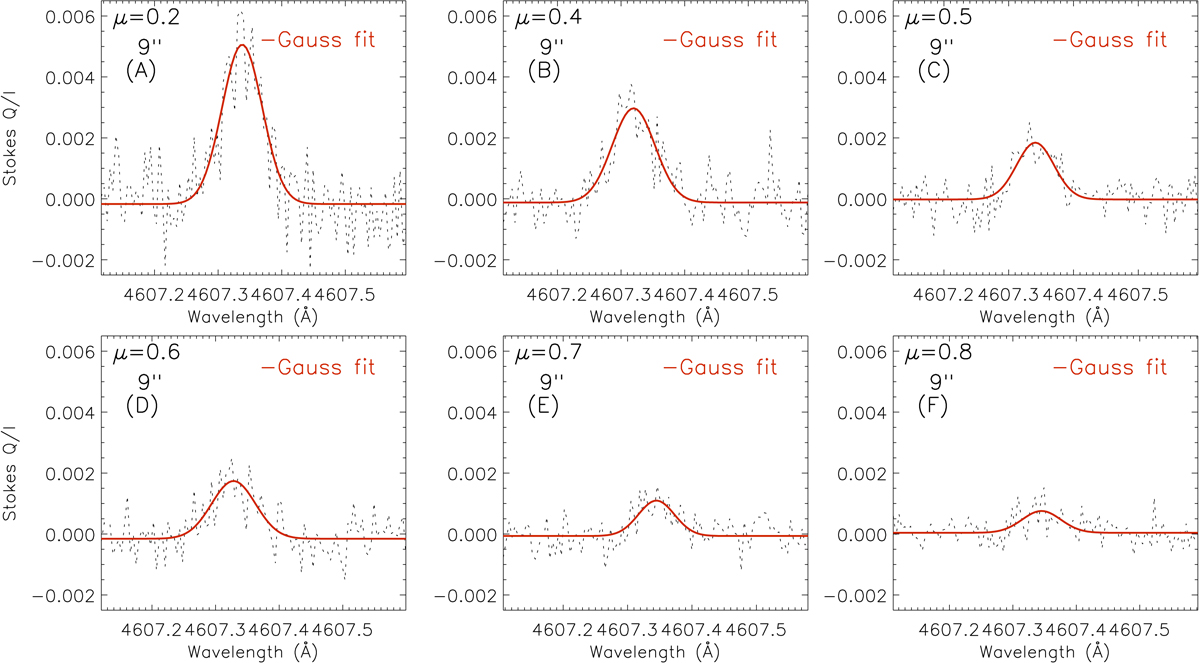
Q/I profiles obtained at 9″ spatial position for μ = 0.2 to 0.8. These profiles correspond to the Stokes Q/I images shown in Fig. 1 (panels A–F). The red lines are the Gaussian fits to the profiles.
Current usage metrics show cumulative count of Article Views (full-text article views including HTML views, PDF and ePub downloads, according to the available data) and Abstracts Views on Vision4Press platform.
Data correspond to usage on the plateform after 2015. The current usage metrics is available 48-96 hours after online publication and is updated daily on week days.
Initial download of the metrics may take a while.