Fig. 4
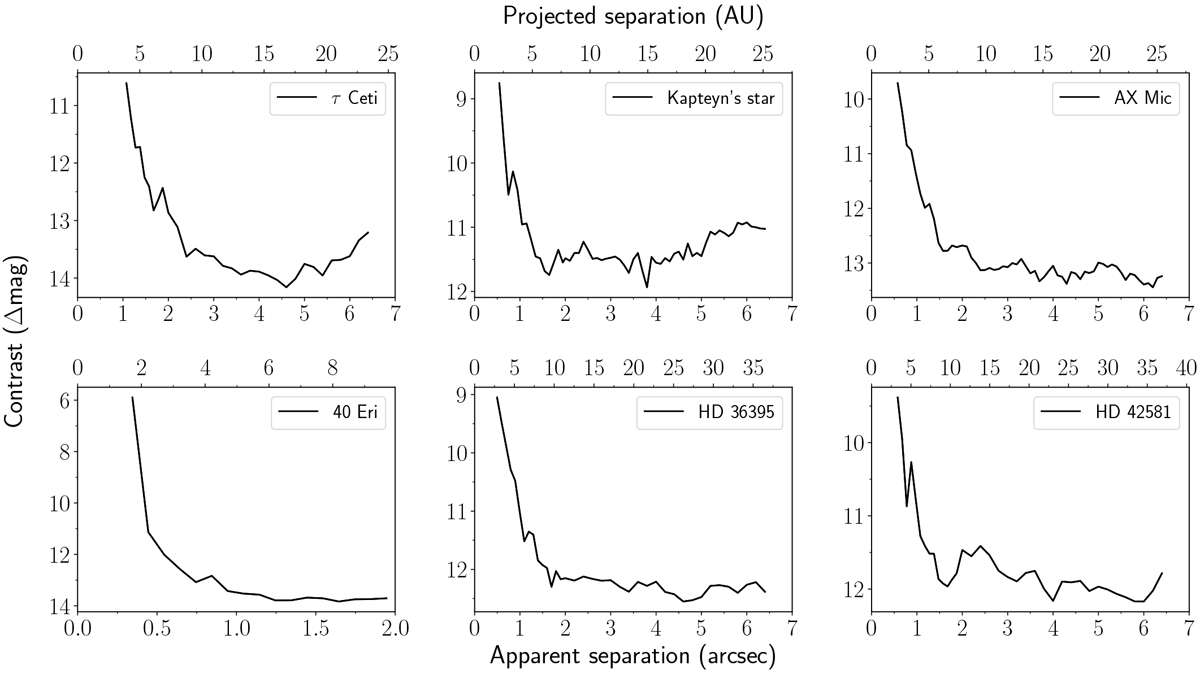
Limiting contrast curves for each star. The line plotted here is the contrast for a fixed false positive fraction (FPF) of 2.9 × 10⁻⁷, which corresponds to a five-sigma detection threshold for an underlying Gaussian distribution and for large sample sizes. These curves differ from the classical contrast curves since these give contrast for a fixed five-sigma detection threshold and thus the FPF changes at close separations due to small number statistics (see Mawet et al. 2014). The limiting contrast shown here is an average of the contrast at three evenly spaced position angles (0°, 120°, and 240°). The typicalstandard deviation of the contrasts computed at these three position angles is 0.15 mag for a given separation. We do not plot limiting contrasts for the separations at which the specified FPF could not be achieved due to self-subtraction.
Current usage metrics show cumulative count of Article Views (full-text article views including HTML views, PDF and ePub downloads, according to the available data) and Abstracts Views on Vision4Press platform.
Data correspond to usage on the plateform after 2015. The current usage metrics is available 48-96 hours after online publication and is updated daily on week days.
Initial download of the metrics may take a while.