Fig. 1
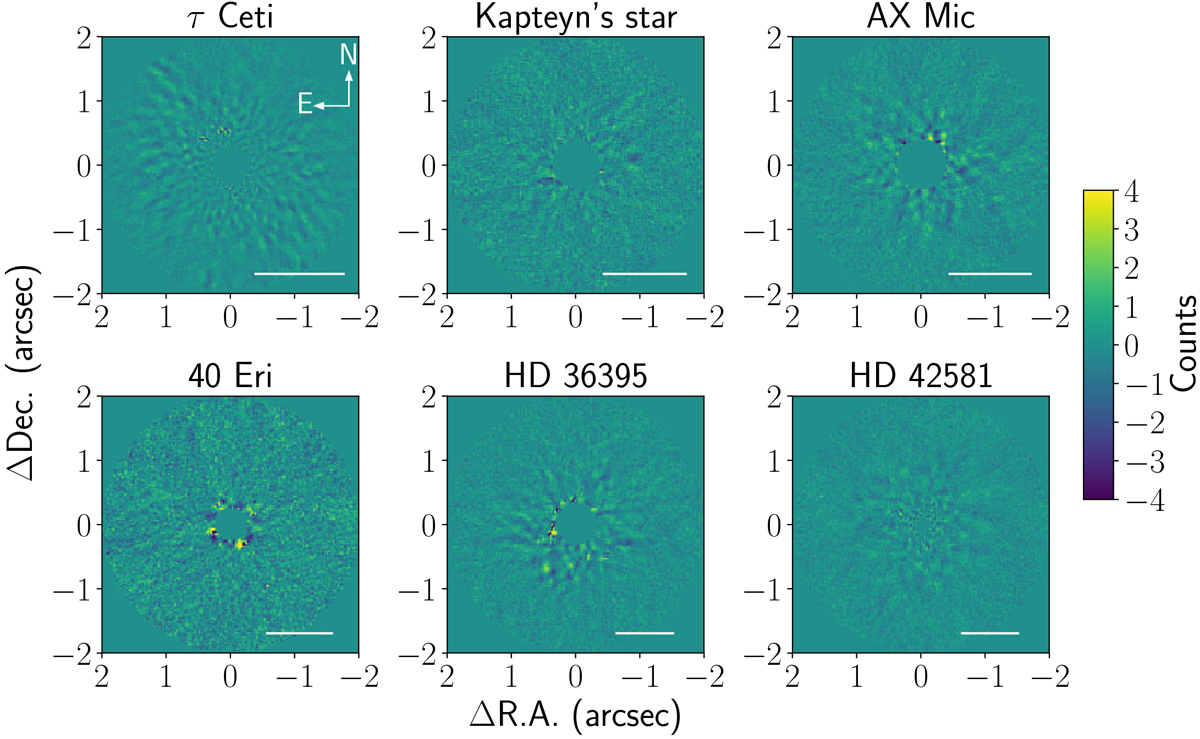
PSF-subtracted images for each star, where the stellar point spread function (PSF) was modeled using Principal Component Analysis (PCA). These images were used to search for substellar companions with projected separations out to 2′′ from the star. The central masked region was determined by the amount of field rotation in the data. The white bar in the lower left ofeach image corresponds to 5 AU at the distance of the star. The images are plotted with a linear stretch.
Current usage metrics show cumulative count of Article Views (full-text article views including HTML views, PDF and ePub downloads, according to the available data) and Abstracts Views on Vision4Press platform.
Data correspond to usage on the plateform after 2015. The current usage metrics is available 48-96 hours after online publication and is updated daily on week days.
Initial download of the metrics may take a while.