Free Access
Fig. 9.
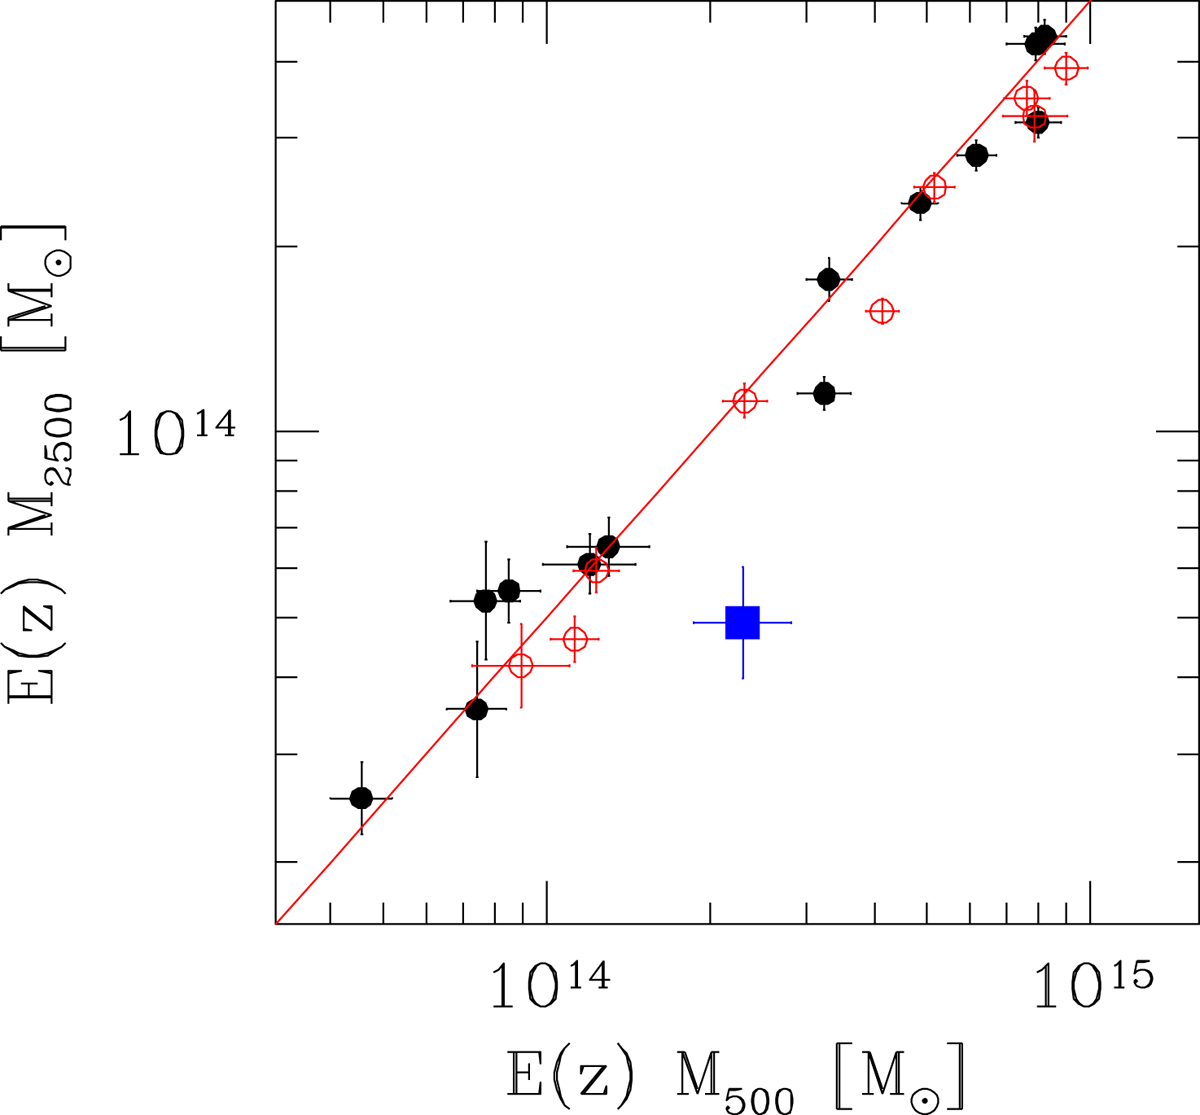
Mass at different overdensities comparison. Masses at two different overdensities, Δ = 500 and Δ = 2500, of CL2015 (blue point), and clusters in Vikhlinin et al. (2006) and Sun et al. (2009) (solid points) and Arnaud et al. (2005, open points) are shown. The red line is the location M500/M2500 = 2.0.
Current usage metrics show cumulative count of Article Views (full-text article views including HTML views, PDF and ePub downloads, according to the available data) and Abstracts Views on Vision4Press platform.
Data correspond to usage on the plateform after 2015. The current usage metrics is available 48-96 hours after online publication and is updated daily on week days.
Initial download of the metrics may take a while.