Fig. 8.
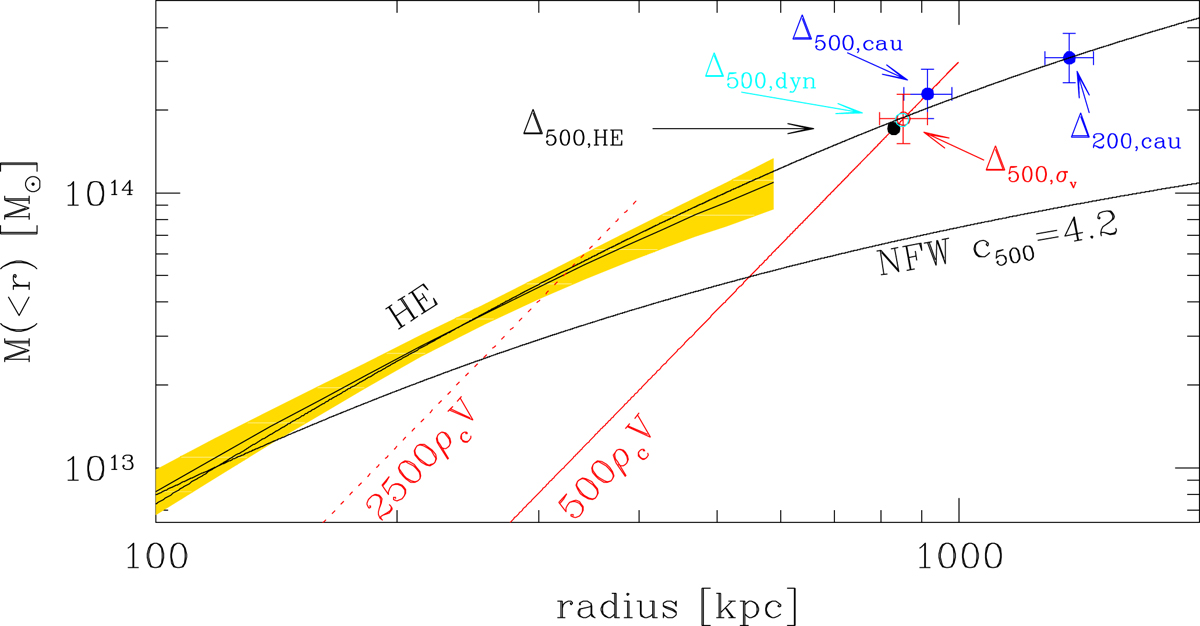
CL2015 mass comparison. Hydrostatic mass (HE) within the radius r (black solid curve) is compared to 500ρcV (solid red line), 2500ρcV (dotted red line), and to caustic, velocity-dispersion-based, and other dynamical masses (blue, red, and cyan points, respectively). We also plot a NFW profile with c500 = 4.2 normalized at r = 100 kpc (bottom curve) and NFW profile with c500 = 1.5 normalized at r200 (top curve fitting all data).
Current usage metrics show cumulative count of Article Views (full-text article views including HTML views, PDF and ePub downloads, according to the available data) and Abstracts Views on Vision4Press platform.
Data correspond to usage on the plateform after 2015. The current usage metrics is available 48-96 hours after online publication and is updated daily on week days.
Initial download of the metrics may take a while.