Free Access
Fig. B.1.
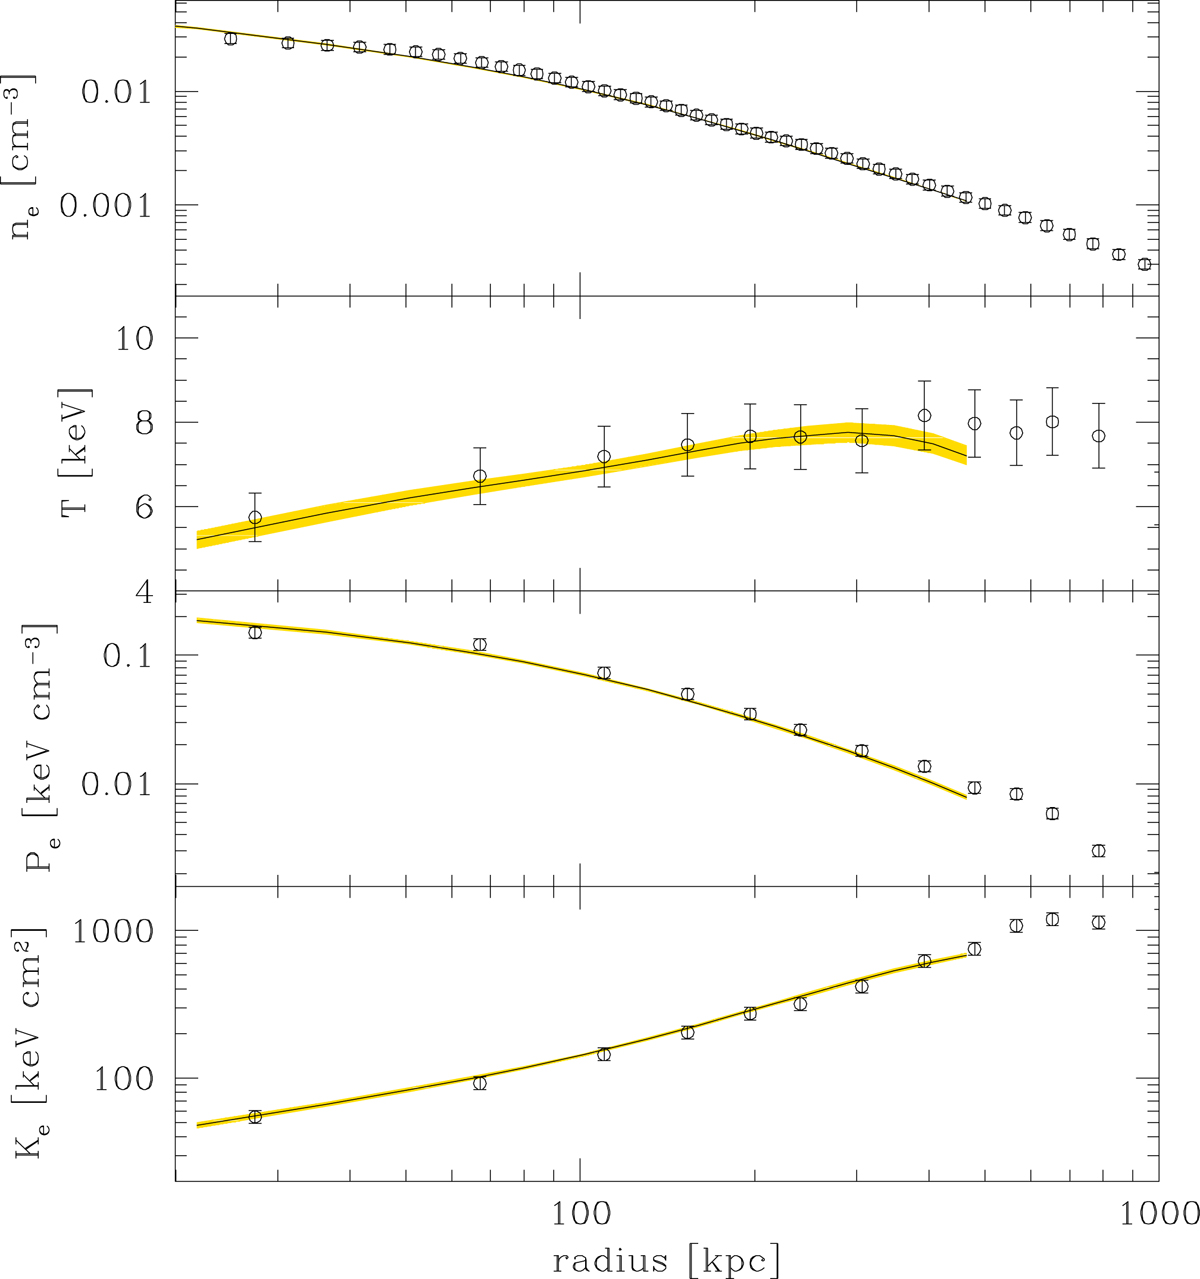
Comparison of XMM and XRT Abell 2029 thermodynamic profiles. Points indicate values derived from XMM (Ghirardini et al. 2019) while error bars indicate ±10% (statistical errors are negligible), whereas our XRT mean model is indicated with a solid line and shading (marking 68% intervals).
Current usage metrics show cumulative count of Article Views (full-text article views including HTML views, PDF and ePub downloads, according to the available data) and Abstracts Views on Vision4Press platform.
Data correspond to usage on the plateform after 2015. The current usage metrics is available 48-96 hours after online publication and is updated daily on week days.
Initial download of the metrics may take a while.