Free Access
Fig. 2.
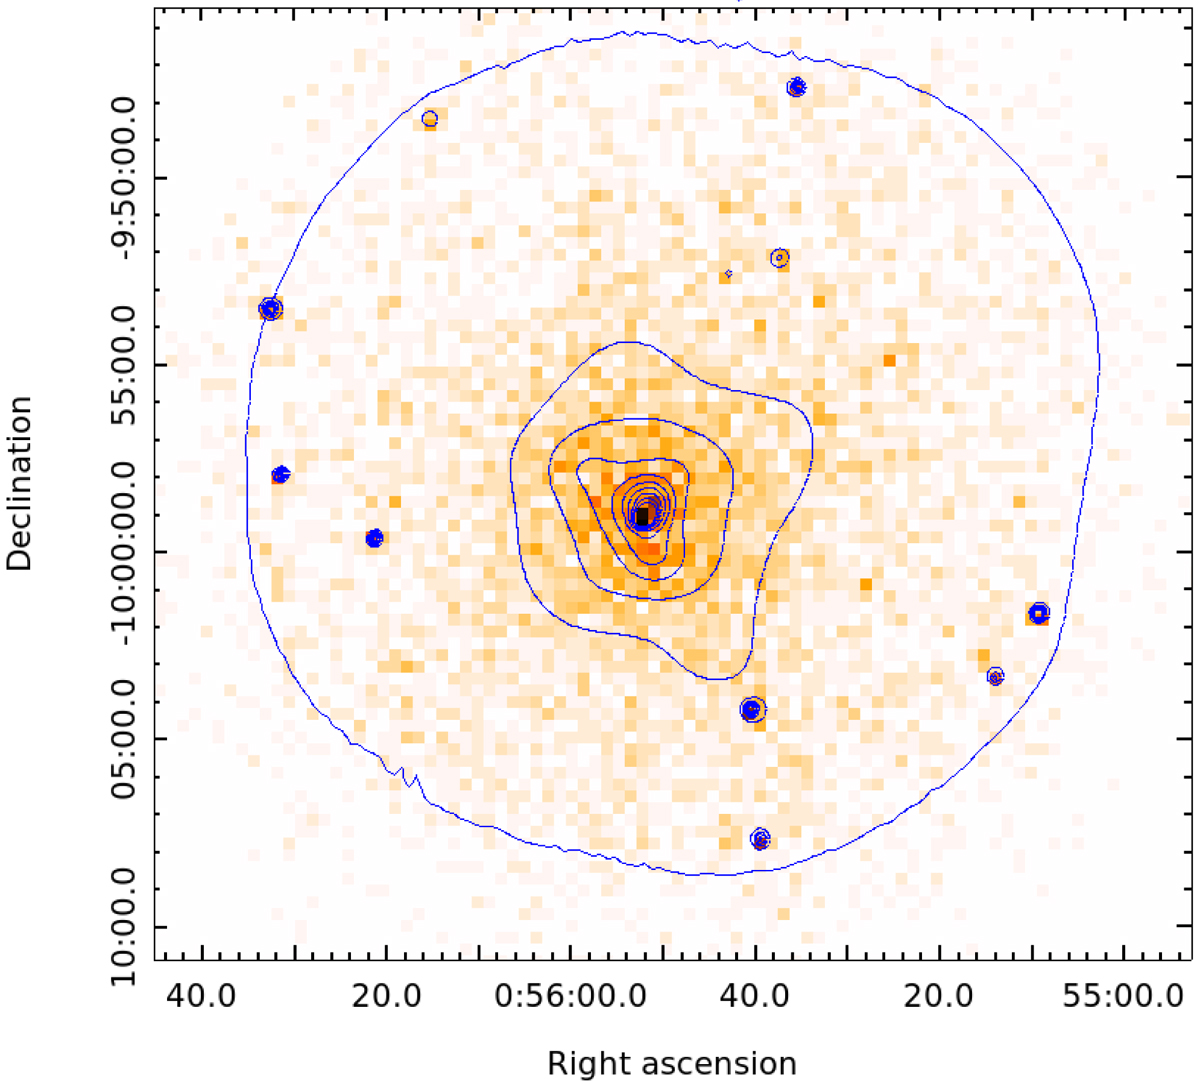
X-ray contours from an adaptively smoothed image (with a minimum significance of 3σ) superimposed onto the binned image ([0.5–2] keV energy band). Contours are in steps of 0.2 counts per 5.53″ pixel, starting from 0.3. The outer region denotes the locus where exposure time is 50% of the on-axis exposure time.
Current usage metrics show cumulative count of Article Views (full-text article views including HTML views, PDF and ePub downloads, according to the available data) and Abstracts Views on Vision4Press platform.
Data correspond to usage on the plateform after 2015. The current usage metrics is available 48-96 hours after online publication and is updated daily on week days.
Initial download of the metrics may take a while.