Fig. 15.
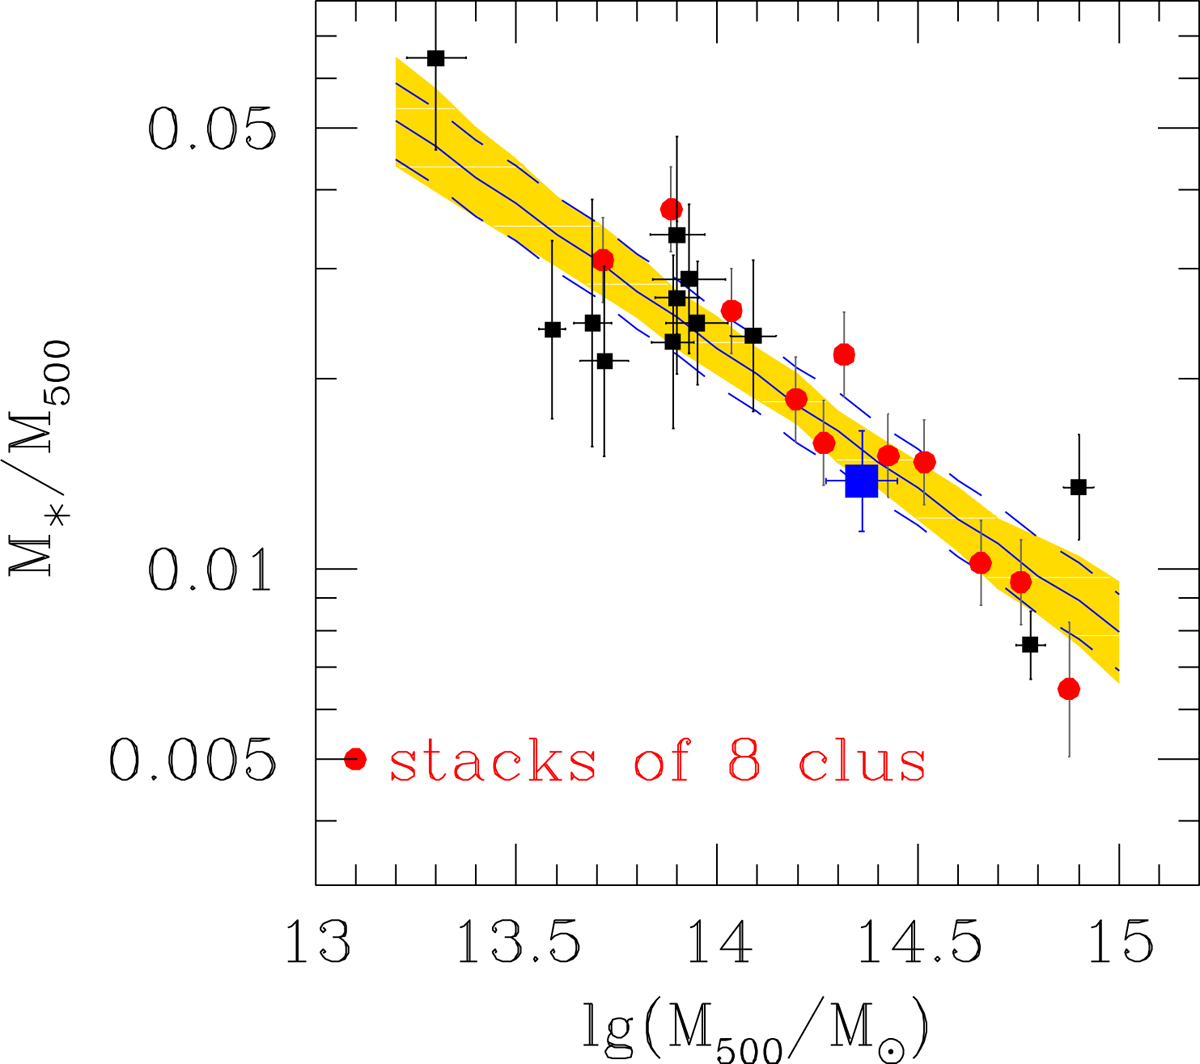
Stellar fraction of CL2015 (solid blue square) compared to other clusters: (a) X-ray relaxed clusters (black points) from Andreon (2012), with stellar mass of Abell 2029 updated in Renzini & Andreon (2014). The solid line is the mean model, while the shading indicates the 68% uncertainty (highest posterior density interval). The dashed corridor is the mean model ± the intrinsic scatter. (b) X-ray selected clusters (red points), after averaging in bins of eight clusters each to emphasize the mean trend while reducing the scatter around the mean relation.
Current usage metrics show cumulative count of Article Views (full-text article views including HTML views, PDF and ePub downloads, according to the available data) and Abstracts Views on Vision4Press platform.
Data correspond to usage on the plateform after 2015. The current usage metrics is available 48-96 hours after online publication and is updated daily on week days.
Initial download of the metrics may take a while.